Written by Charlie Clarke
Kendrys Morales hasn’t exactly come as advertised. While he is still on pace for 30 home runs and has delivered some big hits in big moments, nobody can be thrilled with an overall line of .256/.305/.466. So what has happened to the slugging Cuban?
Last December, BP Toronto’s Elie Waitzer wrote about how Kendrys Morales was thriving against breaking pitches. In 2016, he was. In 2015, he was not. And in 2017, he definitely is not. And pitchers are figuring that out.
Morales has struggled with curveballs all year. Through July 3, he batted a meager .100 with a .150 SLG on curves. Morales batted .364 on sliders through June 1 of this season, but a breakingball tailspin in June tanked his average across the board.
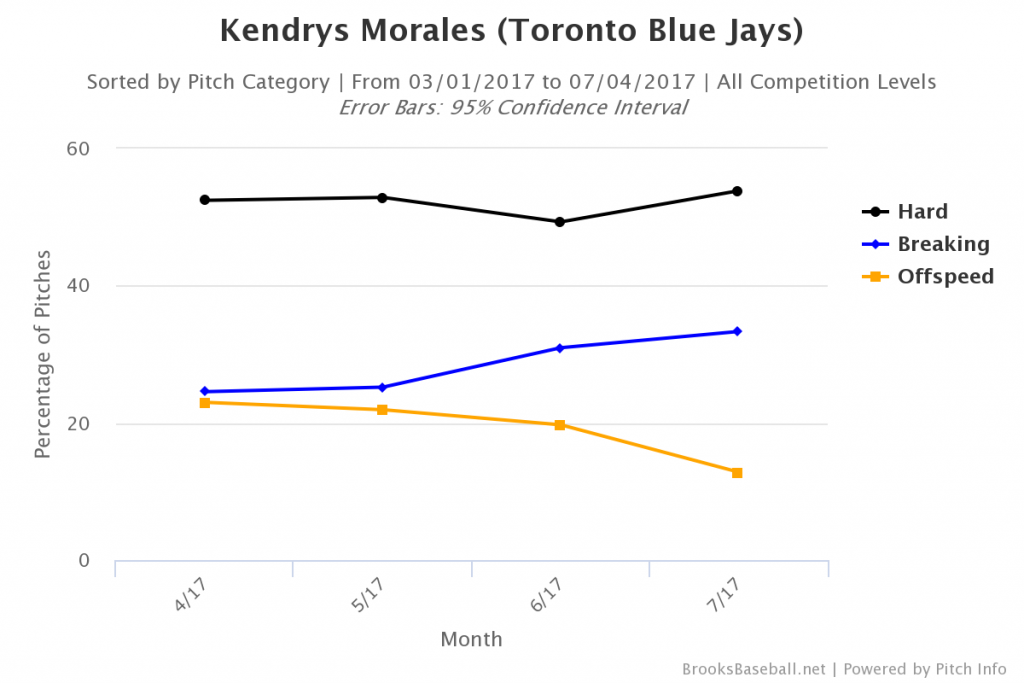
Since June 1, pitchers have thrown more breaking balls to Morales and he has failed to produce on those pitches. He was actually posting solid May numbers (.295/.351/.580, 12 K’s) and on the way to a very good season until pitchers started altering their plan of attack:
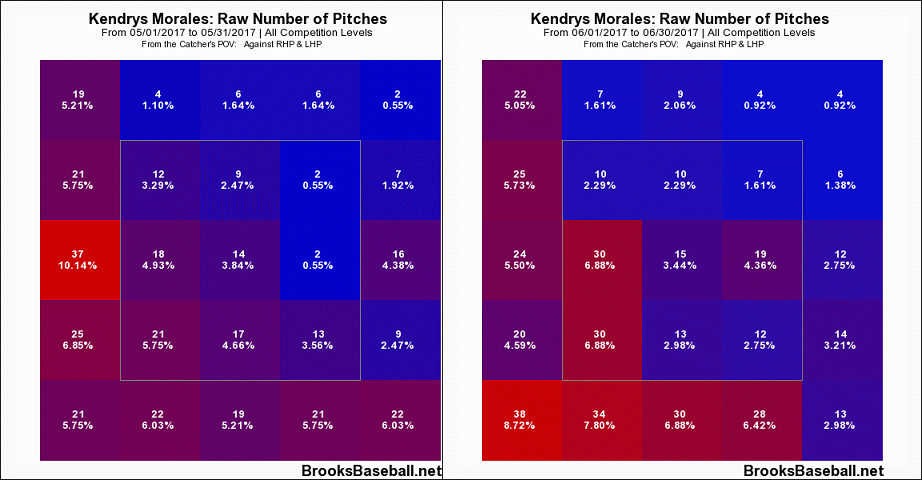
In the month of June, Morales saw 135 breaking balls, the most he has seen in a month throughout his entire career. Pitchers are also dropping these pitches at and below the bottom of the zone, making it much more difficult to make contact.
On the left are pitches Morales saw in May, on the right are the ones he saw in June. As you can see, the lower squares outside of the strike zone are the most common locations for pitches to Morales last month, with a dramatic increase from the prior month. Morales’ numbers dropped off as a result: he struck out 22 more times in June than he did in May, and his line fell from that .295/.351/.580 in May to .257/.286/.447 in June.
The strange part is that Morales’ breakingball performance spiked last season.
This table comes from Waitzer’s article, giving perspective into how well Morales performed against breaking pitches in 2016. Since June of 2017, however, Morales is hitting .200 (.200 SLG) on sliders and .071 (.143 SLG) on curves. The numbers this year suggest that 2016 could have been an aberration in Morales’ post-injury breaking ball performance, though looking at his previous career totals, Morales doesn’t necessarily struggle when he’s thrown more breaking balls.
In June, Morales swung at 54 percent of the breakingballs thrown his way. If he keeps up that swing percentage, expect pitchers to continue to keep attacking that way. It’s about as small of a sample size as it gets, but Morales took all seven breaking pitches he saw in the final game against Boston.
Unfortunately, a minuscule glimpse of optimism doesn’t fully uncover a month-long troubling trend in Morales’ declining performance. If he doesn’t figure out his breaking ball problem, the three year commitment to Morales could start to look very long very quickly.
Lead Photo © Nick Turchiaro-USA TODAY Sports


