Tim Mayza has incredible raw stuff. Over the first 18 and 2/3 innings of his major league career he’s struck out 33.3 percent of the batters he’s faced, which is among baseball’s elite. Roberto Osuna posted an identical strikeout rate in 2017 and ranked 18th among the 235 relievers with 30 or more innings of work last season. Strikeouts aren’t a new thing for Mayza; since the beginning of the 2015 season he has struck out 25.3 percent of the hitters he’s faced in the minor leagues, too.
Strikeouts aren’t the only thing Mayza has piled up over his professional career. Observers have been flummoxed by the amount of contact – and hard contact – he has surrendered. Mayza has given up 26 hits over those 18.2 innings in Toronto, after being a hit-per-inning (228 in 229.2 innings) guy across parts of six minor league seasons. Strikeout rate is one of the single best end-points we have for “stuff”, and guys with elite stuff generally don’t get hit around in this manner.
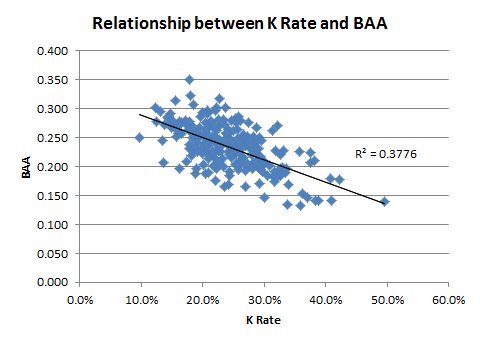
The figure above plots the strikeout rate and batting average against for the aforementioned 235 relievers with 30 or more innings pitched in 2017. There is a reasonably strong correlation between the two, in the direction one would expect: guys with the stuff to support a high strikeout rate generally don’t surrender a whole lot of base hits. Based on the slope of the trend line, a guy with a strikeout rate of 33.3 percent like Tim Mayza should have an opposing batting average of .199. Instead, reality has presented a much uglier .317 career batting average against.
Mayza isn’t simply being BABIP’d either; those 26 base hits have included six doubles and three home runs. Interestingly, eight of the nine extra base hits surrendered have come against his fastball, and not one of them was a cheapie: all eight left the bat between 97 and 109 miles per hour. Just one extra base hit – a 90.2 mile per hour ground ball double – came off Mayza’s slider.
The slider has not been a problem. With Toronto, the opposition has hit just .250/.250/.271 against it. The 172 sliders he threw in 2017 resulted in a whiff per swing rate of 52.1 percent, which ranked third among the 80 lefthanded pitchers to throw 100 or more sliders. In addition, its 55 percent groundball rate ranked ninth among the same group. Batters have struggled to make contact with Mayza’s slider – and when they do, the ball doesn’t go particularly far.
In this modern era of baseball, with hitters amplifying their launch angles to generate more power, pitchers have countered by throwing more and more breaking balls. With his fastball getting crushed and his slider nearly untouchable, the answer for Tim Mayza would seem to be clear as day. But it’s not, because Mayza is already throwing his slider approximately 50 percent of the time and there’s something far more peculiar (and fixable) happening: he’s tipping his pitches.
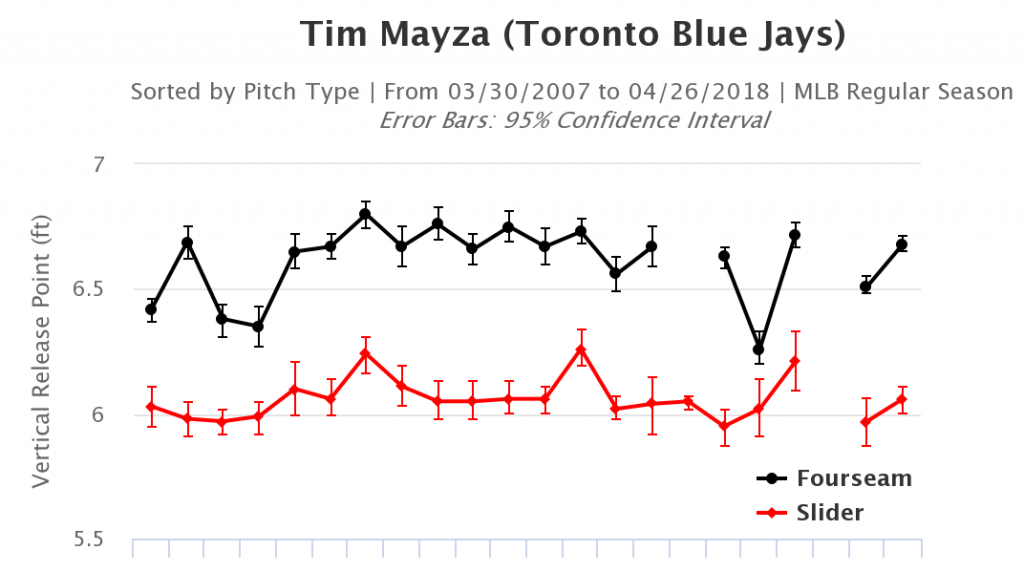
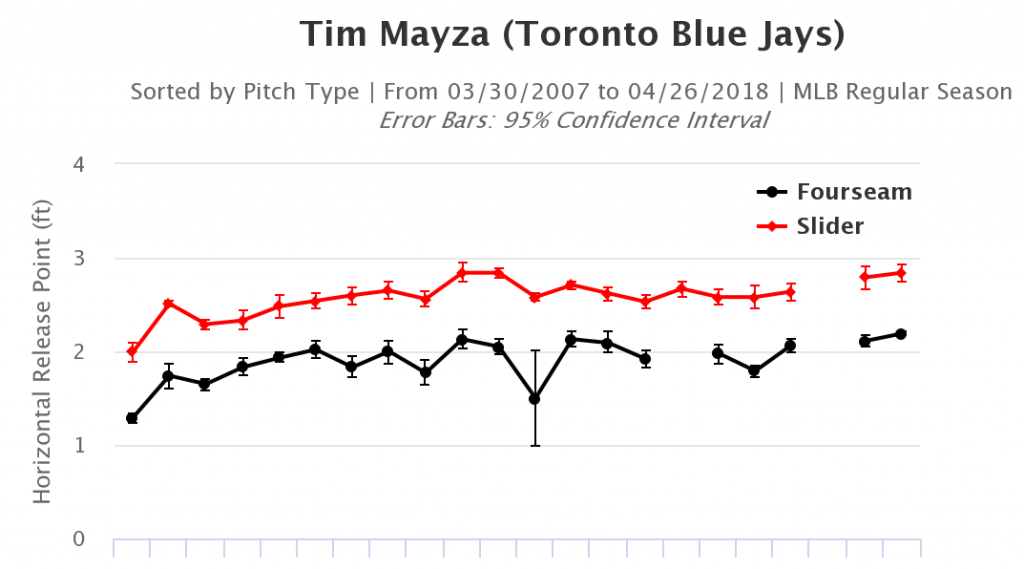
The two figures above, via Brooks Baseball, show Mayza’s game-by-game average release points for his four seam fastball and slider. The two pitch types are consistent in how inconsistent they are from one another. For his career, the two pitches have averaged eight inches of vertical release differential (with the fastball higher) and 6.5 inches of horizontal release differential (with the slider further from the rubber). A quick calculation using Pythagorean Theorem gives an average differential of 10.3 inches between the release points of the two pitch types.
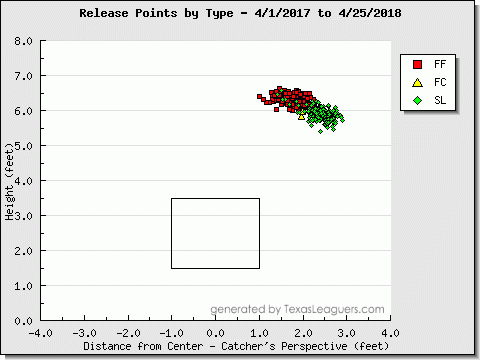
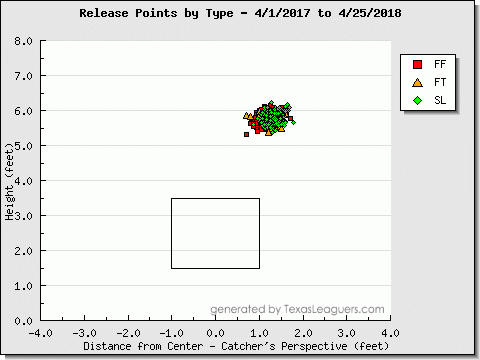
The figure above, via Texas Leaguers, offers a more visual representation of Mayza’s hand position at his release point from the perspective of the catcher. A few sliders were thrown from the fastball domain, but otherwise, the release points of the two pitch types couldn’t be much more clearly defined. The camera angle from the TV broadcast might make this a bit more challenging to pick up, but for a seasoned hitter at the plate, Mayza might as well be throwing differently colored baseballs.
For a bit of context, the figure above is Boone Logan’s release point plot over the same period of time. In terms of velocity and movement, Logan’s slider is among Mayza’s most comparable peers. The two even have similar enough fastballs. The biggest difference between the two is that Logan’s release point looks like a freshly opened bag of Skittles in contrast to Mayza’s, which appears to be a re-enactment of a battle from the game of Risk.
Another way of analyzing Mayza’s pitch tipping issue is through the Pitch Tunneling feature at Baseball Prospectus. One of the metrics it measures is “Release Distance”, which tells us exactly how far apart two back-to-back pitches are released in a sequence. In total, 631 pitchers threw 100 or more pitch pairs/sequences in 2017. Mayza had the sixth largest (read: worst) average release tunnel at 5.8 inches across 261 total sequences. The league average across this sample was just 2.6 inches.
Mayza’s tunneling ability looks even worse when breaking down the 261 sequences by specific pitch patterns.
|
Usage Pattern |
Count | Avg. Release Tunnel (in.) |
|
SL → FB |
56 | 9.99 |
|
SL → SL |
73 | 2.21 |
|
FB → SL |
61 |
10.41 |
| FB → FB | 71 |
2.22 |
| Same → Same | 144 |
2.21 |
| Diff. → Diff. | 117 |
10.21 |
When Mayza doubles up on a pitch – which he did a total of 144 times in 2017 – his average release tunnel of 2.21 inches was really good. The inconsistencies occurred when he went slider to fastball or vice versa, for which he had an average release tunnel of a dreadful 10.21 inches. Without doing a similar analysis for all 631 pitchers in the sample it is impossible to precisely quantify where 10.21 inches would rank, but I think “poorly” should serve as a sufficient qualitative answer.
The final piece of evidence is perhaps the most damning of all; a video recorded from behind home plate when the lefty was warming up prior to an appearance in the Arizona Fall League in 2016. The circumstances are as close as you or I will ever get to standing in the box against Tim Mayza, and the yellow marking on the outfield fence offers an ideal reference point. Mayza throws seven pitches in the 56 second clip: three fastballs, followed by two sliders and two more fastballs. On each fastball, Mayza’s hand cuts through the yellow coloration on the outfield fence, and on each slider, his hand remains noticeably below that threshold. If we can pick up the difference in release point in real time, rest assured the competition can as well.
The left handed relief depth chart for the Blue Jays isn’t a particularly deep one, and manager John Gibbons has regularly voiced his preference for having a second lefty out there. Not only is Mayza currently the number two lefty by default – there’s no other left handed relievers on the 40 Man Roster – but with Aaron Loup’s startling inconsistencies over the last three-plus years, it could be argued the top spot is available if Mayza could string together some impressive appearances when he returns from Buffalo. With his only flaw so apparent and seemingly fixable, Mayza may be just a mechanical adjustment away from seizing a valuable and lucrative opportunity.
Lead Photo © Dan Hamilton-USA TODAY Sports

