Ever since moving into the Blue Jays rotation on May 5, 2015, Marco Estrada has been one of the more effective pitchers in the American League and an extremely reliable member of the Toronto starting five (or six). As such, it should surprise nobody to see that Estrada is currently sporting a 3.60 ERA or that he has allowed two or fewer runs in six of his nine starts. He has his hiccups like any other pitcher (especially against Tampa), but Blue Jays fans feel confident every time the Sonora, Mexico native takes the mound.
While still good, however, this may not be the same Marco Estrada that we’ve seen for the last two years. To find out for certain, we need to look a bit deeper at Estrada’s performance so far this year.
The difference that jumps out immediately is that Estrada is getting strikeouts again. Last year he started to bring them back (22.8 K%) after a contact heavy 2015, but they’ve taken another leap forward this year to 25.4 percent, a rate which the righthander hasn’t reached since the 2012 season in Milwaukee.
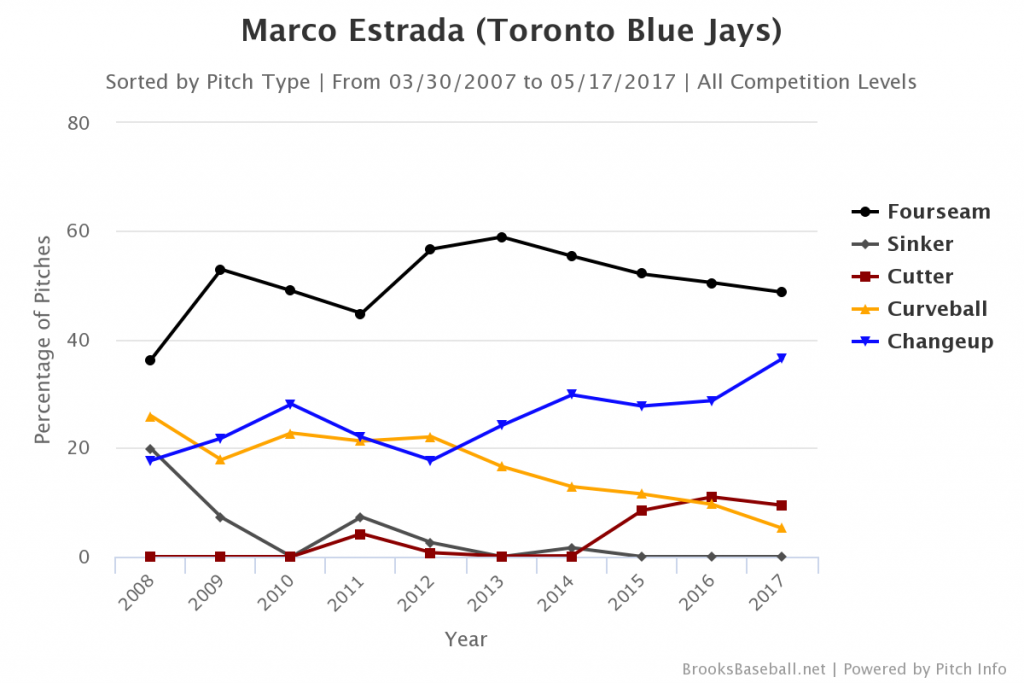
While that jump is certainly significant, it’s not exactly enough to tell us what is happening. As John Lott wrote earlier this week at The Athletic, we do know that Estrada has changed his pitch mix for this year:
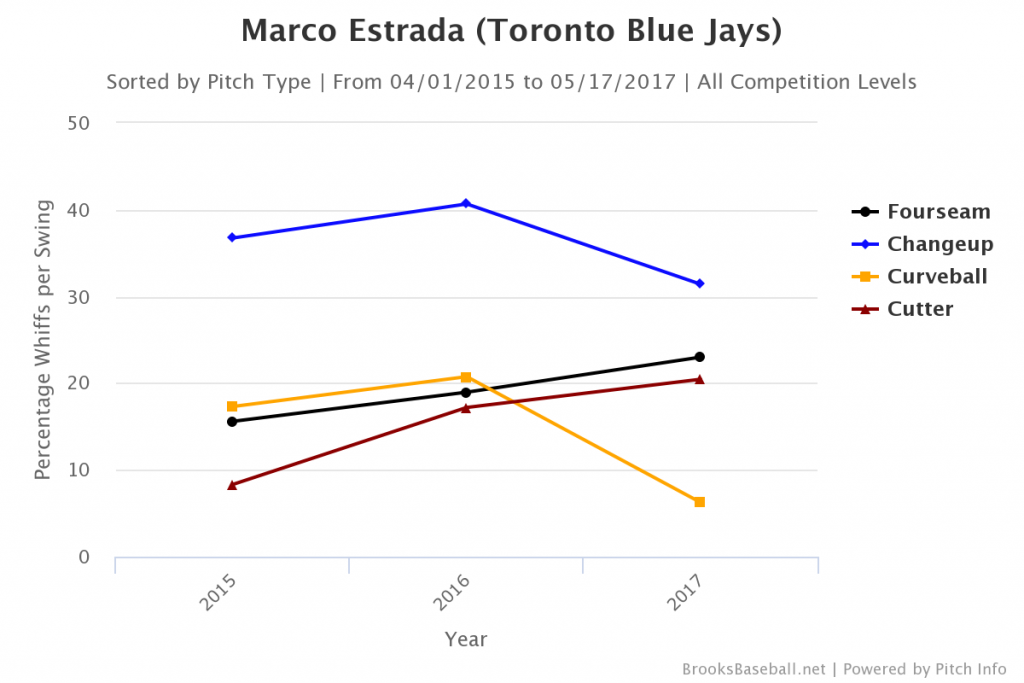
As you can see, Estrada is throwing more changeups this year than ever before. Given that the pitch generates more whiffs than anything else Estrada throws, that would seem to explain the change. However, that’s not the case. In fact, Estrada is actually getting fewer swings and misses on the changeup than normal:
Typically one would assume that the increase in strikeouts would come with a similar increase in swings and misses. While he’s getting more whiffs on fastballs and cutters, overall the opposite is actually happening. Last year hitters made contact on 76 percent of swings against Estrada, while this year it has actually risen (albeit marginally) to 76.9 percent.
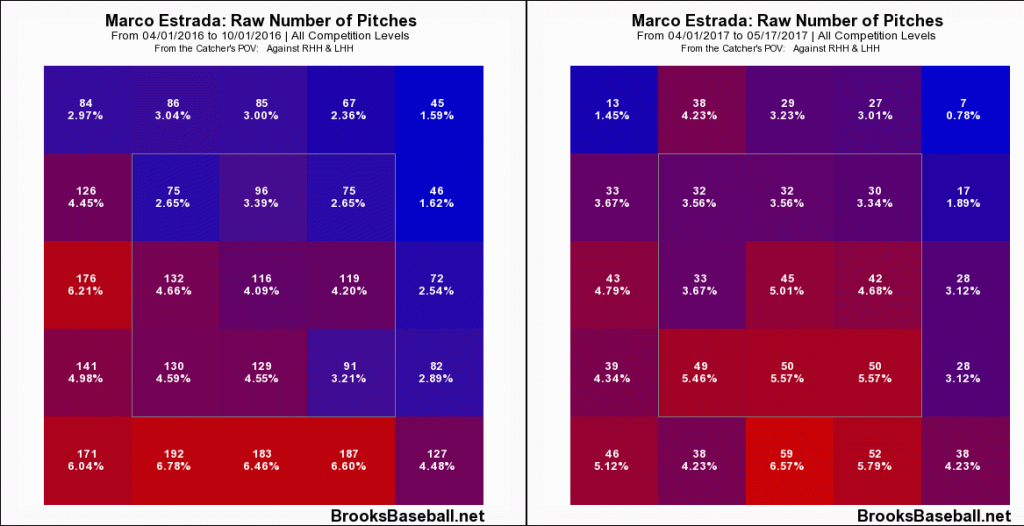
Instead, Estrada is throwing more strikes overall, with 51 percent of his pitches ending up in the strike zone this season (career 47.8 percent). We can see this by looking at his comparative pitch location grid from 2016-2017:
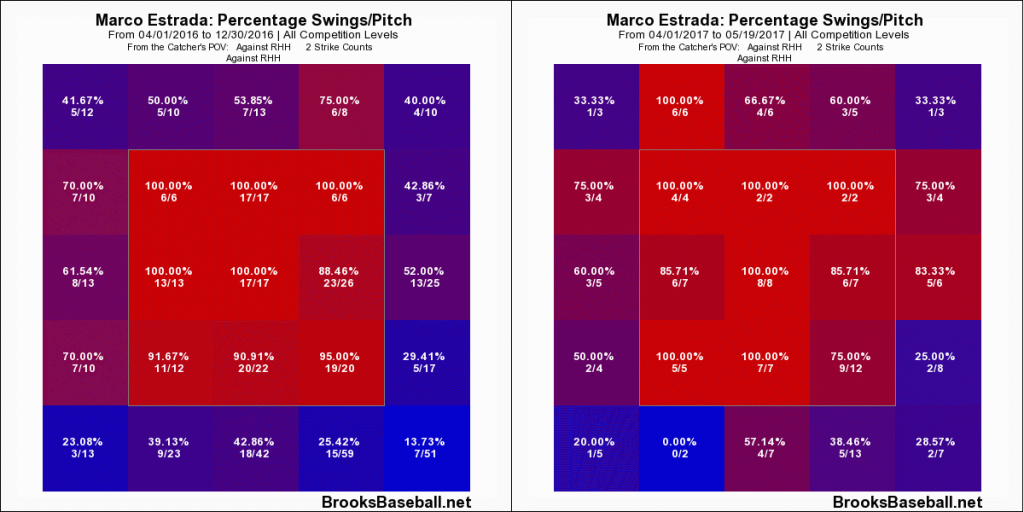
While the shading on those charts can suggest greater differences than actually exist, there are clear indications that Estrada is pitching both more in the zone overall and specifically down and to his glove side (right on the grid). Why does this matter for strikeouts? As we’ve established, Estrada isn’t getting extra swings and misses, so he needs more people taking with two strikes.
This is accomplished in two ways. First, he gets more people guessing by throwing the changeup nearly as often as the fastball (which is evidenced by the increased whiff rate on his hard stuff).
By combining that with a spot low and away to where it’s tough to pick up (100% of the increased takes in that spot are vs RHBs), Estrada is getting hitters to hesitate just long enough to take strike three. He already has five strikeouts looking against righties this year on pitches that are actually in the strike zone – not umpire errors – when he only had seven all of last year.
It hasn’t all been rosy this year, however. While the strikeouts are good, batters are getting hits far more often against Estrada. The overall increase in contact will naturally cause raw hit totals to go up, but the rate at which people are getting hits has risen dramatically. In 2015 and 2016, Marco Estrada led the league in H/9 at 6.7 and 6.8, respectively. That number has risen to 8.2 this year.
What should be more encouraging (again on the surface) is that those hit rates are coming with a .293 BABIP. To most people, that probably sounds completely normal. It’s right in the league average range and thus would seem like there is no real sign of regression. Except if you’ve followed Marco Estrada, you know .293 is unusually high. Estrada’s career BABIP is .258, with rates of just .216 and .234 in the last couple of years.
Estrada has always been able to generate these low averages on balls in play on the back of his incredible ability to get hitters to pop the ball up. Unfortunately, those seem to have gone away too:
As you can see, Estrada has changed from an all-world popup artist into one that is average at best. Given everything we know about the man who once had fans hanging Pizza Pop signs from the balconies for pop outs, this is extremely surprising. This shows up in the launch angle data as well:
The average launch angle on Estrada’s pitches this year is way, way down. In fact, his GB/FB rate is up to 0.81, the highest it has been since 2013, which came before Estrada raised his arm angle. While the increase in changeups would account for a slight decline, Estrada’s popup rates are down for every pitch, including his famously “rising” fastball.
Once again though, there is good news on this front which suggests the ship will right itself. For starters, batters aren’t hitting the ball any harder against Estrada this year than they did in the past (average exit velocities of 87.4/87.3 mph in 2015/2016, 87.4 mph this year). More importantly though, there has been no decline in the quality of Estrada’s stuff.
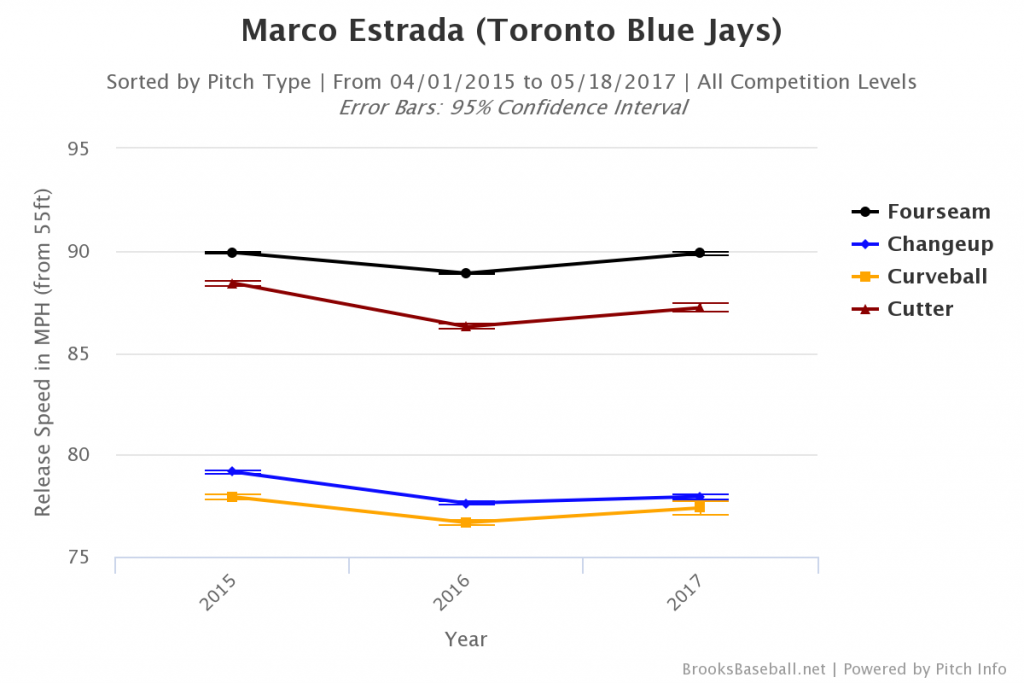
As most people have probably noticed, Estrada is throwing a bit harder this year. His average fastball is over a mile per hour harder this year than last. This brings each of his offering back to his breakout 2015 levels, which we would expect now that Estrada seems to be clear of the back issues that plagued him for much of last season (forcing two DL stints).
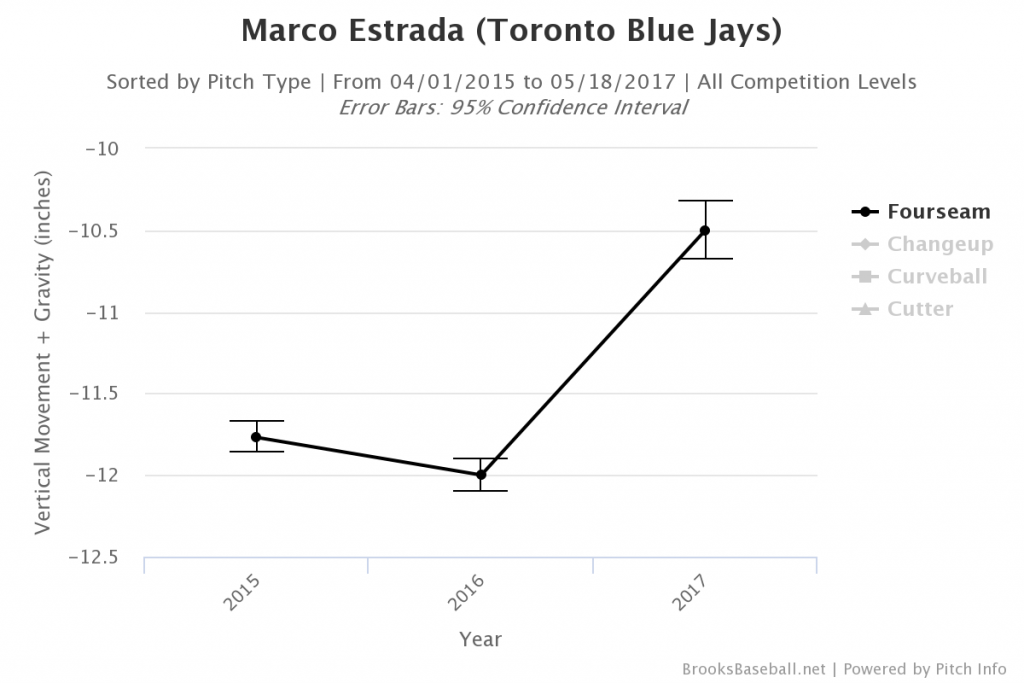
From the look of those graphs, it seems as if Estrada is getting even MORE rise on his pitches than last year. This might not actually be the case, as I have been informed that the conversion INSERT could account for the difference here, but at worst this means the movement is essentially unchanged for both offerings (with no change in release point or spin rate, this follows logically). When you combine that with the velocity increase, that actually creates even more of a “rising” sensation than Estrada was showing in the past. This is just simple physics, because the ball is taking less time to travel to the plate, there is less time for the pitch to fall.
While the data again is a bit difficult to trust, what’s specifically notable is the gap between the increase in fastball “rise” from 2016 to 2017 (0.39 inches) and the decrease in the rate at which Estrada’s fastball is falling due to gravity (1.5 inches). Even if the data can’t be compared to last year, we can compare the difference within the current system to the difference from last year. Thus, if we assume his overall rise is actually the same 13” from last year, batters would still be seeing the ball a whole inch higher in 2017.
All in all, there is actually no really obvious reason for batters to be hitting the ball in the air less – and in fact reasons to think it should even rise from last year’s career high launch angle and popup rate – which suggests this will turn around very soon. And if he keeps up the increased strike rate, all the better.
To make a long post short, Marco Estrada is doing things a little bit differently, but they will probably end up the same. All that means is that we’ll once again get to watch one of the best pitchers in the league for as long as he’s in a Blue Jays uniform.
Lead Photo © Nick Turchiaro-USA TODAY Sports
