Brett Cecil has been with the Blue Jays organization since he was drafted in the supplemental 1st round in 2007. After struggling to stick as a starter, Cecil has carved out a nice career as a high-leverage, power reliever. However, he’s still had his share of bumps along his road to stardom. Perhaps the past two years represent this as well as any sample possibly could. From June 24th onward last season, Brett Cecil did not allow an earned run. During that stretch he pitched 31 2/3 innings, struck out 44 batters, and walked just four. Nobody was better.
That scoreless streak ended in his second appearance of the 2016 season, on April 5th, when Cecil allowed two earned runs. Since then, Cecil has gone on to allow another 13 earned runs, for a total of 15 in 27 2/3 innings pitched. That works out to an ERA of 4.88. He’s struck out 31 batters in that time span, and walked eight. After being the best relief pitcher in baseball for more than three months last season, Cecil has been pitching like the guy that failed in the rotation; that is to say, very poorly.
Why? What is going wrong in 2016 that didn’t happen in 2015 that is causing Cecil to fail so much?
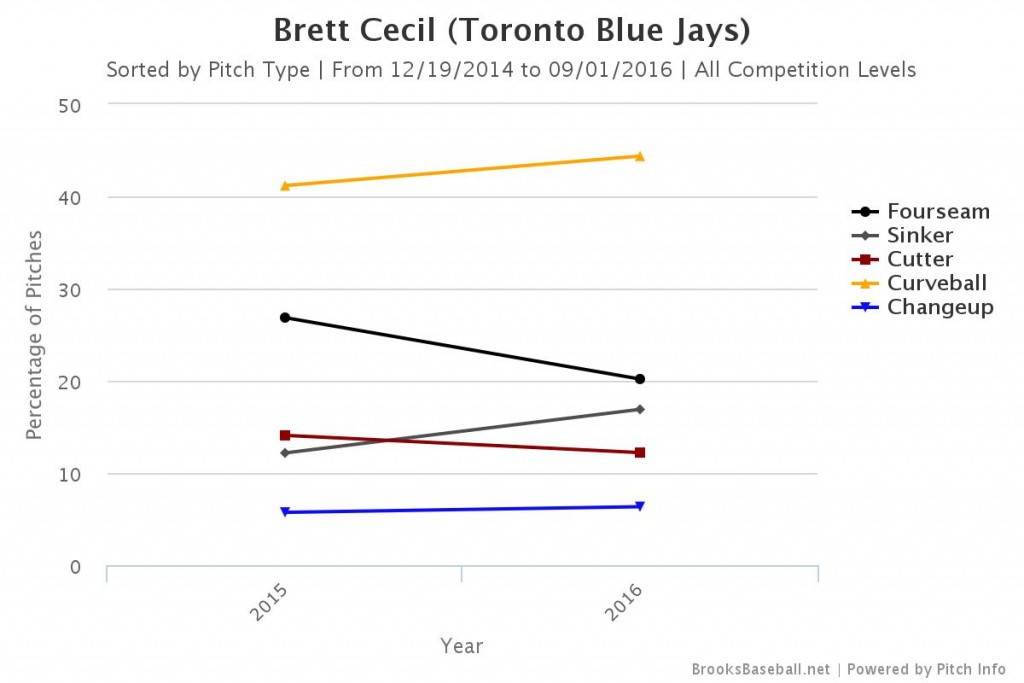
With Cecil, it’s all about the curveball. His success, and his failure, is predicated on its use. Last year, when he wasn’t using it as much as he should have been, he struggled. When he increased its frequency, he started to get results. The reasoning is simple: It’s one of the best pitches in baseball. Logic dictates that the more it’s thrown, the better it will be for Cecil. Comparing Cecil’s pitch usage from last year to this year, you can see that its use has remained relatively constant.
We can’t point to something in that chart and say that it is why Cecil has been struggling. However, in 2016, batters are hitting .268/.317/.375 off of the curveball. Last year, it was .152/.170/.207. The obvious hypothesis to make from those two sets of numbers is that Cecil isn’t throwing the same curveball this season that he was last year. If it isn’t the same curveball, it doesn’t matter how much he throws it. Something must be different in the stuff that has allowed batters to rip what was one of the deadliest pitches in baseball just 12 months ago, right?. Let’s look at the data.
Apparently the obvious hypothesis was wrong. The velocity is basically the same as it was in 2015. The spin rate is largely the same. The breaking distance, both horizontal and vertical, is the same. The movement, is the same. The breaking angles are…the same. In general, it has been the same pitch thrown in 2016 that was thrown in 2015. And yet, Cecil is getting killed by the opposition when he throws it, as if he was a lion in Zimbabwe and they are dentists.
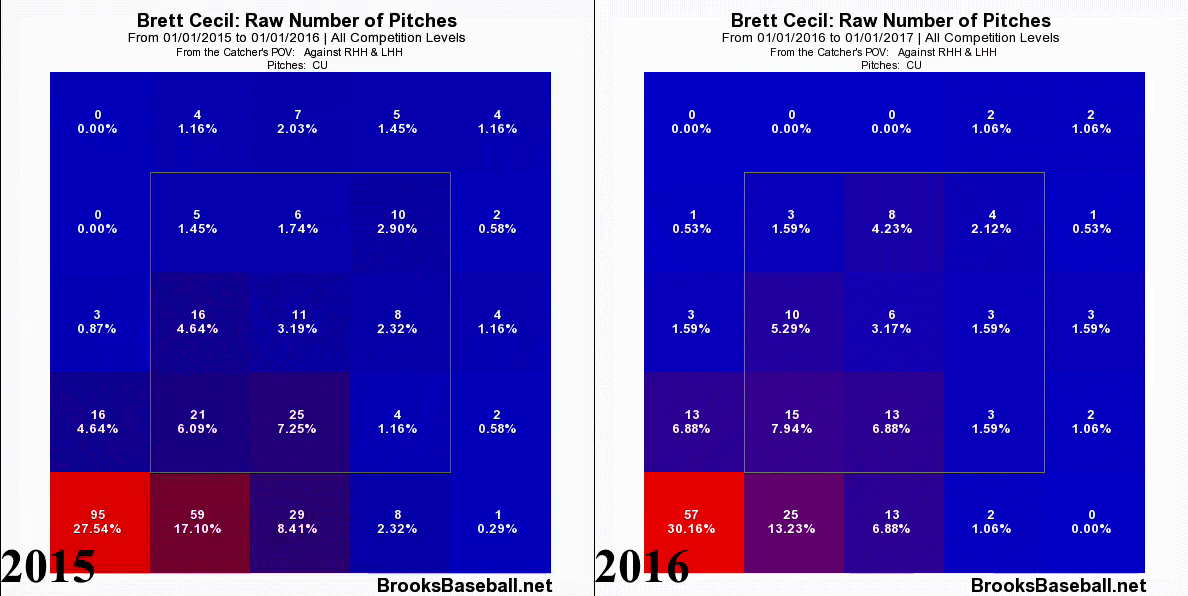
So what’s different? If it isn’t the stuff, what is it? Well, it could be command of the pitch. A curveball down and out of the zone is effective. The same pitch left in the middle is not. Here’s Cecil’s placement of curve balls in 2015 versus 2016. Note the percentage changes in the upper half boxes.
Cecil has started to miss with his curveball more often in 2016, leading to hanging pitches that batters can take advantage of for hits. When the curveball is left up in the zone, it becomes useless. It’s meant to get batters to chase, and if they are getting pitches up in the zone, they are going to go for hits more often than when the pitch is down at their knees or below. Relievers pitch in such small samples that only a few balls left up in the zone can have a drastic impact on one’s stats, as the curve has had in 2016 for Cecil.
There’s another funky statistic surrounding Cecil this season, and that’s the home run ball. In a full season last year, Cecil allowed four home runs. This year, in half the number of innings pitched, Cecil has already allowed five home runs. Surprisingly, this is good news for Cecil. Why? Because it’s completely unsustainable. Yes, the home runs are being caused because he cannot command his pitches, and thus batters are getting better pitches to hit, but Cecil’s HR/FB rate right now is 19.2 percent. His career mark is 11.9. A jump that high is not a sustainable leap, especially because his fastball command is virtually the same as it was last year, or even slightly better. Reliever sample sizes are so small that one bad pitch here and another mistake there means numbers can be skewed greatly by factors that likely aren’t talent based. Relievers are known to be volatile for this exact reason. For Cecil, it seems as if the reasoning behind the increased HR/FB rate is just that; bad luck. Given enough time, that should correct itself. Some flyballs are going to start staying the ballpark, and Cecil will find himself on the right side of success again.
Cecil has struggled this year. There’s no denying it. However, he’s just as talented as he was last season, and his stuff is just as good. It seems as if it has just been a case of Cecil not having the best command of his curveball thus far, and a bit of bad luck mixed in as well. The Blue Jays desperately need Cecil to return to his form for the stretch run if they want to go far, and it’s encouraging that the problems aren’t very deeply rooted. If he had lost velocity, that would be a concern. If his curveball wasn’t spinning like it used to, that would be a concern. But, some command issues that have plagued him all his career in separate pockets resurfacing? That isn’t the biggest deal. He can work those out, and if he does, with some good luck, can once again be counted on to get outs in big spots for the Blue Jays.
His true talent level isn’t the best relief pitcher in baseball as the stats showed last year, but it isn’t one of the worst either. There’s a happy medium, and now Cecil just has to find it. Sooner, rather than later, would be preferable.
All stats as of August 31st 2016
Lead Photo: Nick Turchiaro-USA TODAY Sports


I have a different hypothesis. I actually don’t see a dramatic difference between the 2015 and 2016 strike zone heat maps. Yes, a few more percentages of pitches are missing higher in the strike zone, but that’s minuscule compared to the 27 to 30% of pitches still hitting that lower left corner.
“We can’t point to something in that chart and say that it is why Cecil has been struggling.” I disagree. Consider how batters respond to pitch selection. The line graph shows that in 2015, Brett Cecil pitched a little more than 10% more curve balls than four-seamers. So far in 2016, he’s pitched about 5% more curve balls, and almost 10% fewer four-seamers than the year before. This means that in 2016, he’s pitched almost 25% fewer four-seamers than curve balls. This is significant because the effectiveness of a pitch doesn’t just depend on its independent characteristics (i.e. speed, break, spin rate, etc.), it depends on how it contrasts with other pitches in the pitcher’s arsenal. Throwing more of the same pitch allows batters to adjust to the pitch more easily, making it more “hittable. ”
Sometimes I think that with all the data available and analyses that can be done these days, it’s too easy to “over-focus” on the fine details of a player’s performance, while losing sight of the big picture. Baseball’s a multi-layered game, and a player’s performance is affected on each layer, from the spin rate of the ball, to the biomechanics of the pitcher, pitch selection, batters they typically face, innings they’re brought into, innings worked, pitch count, weekly schedule of playing time and breaks, seasonal strategies by the manager, etc. I think it’s important to consider that pitch characteristics (e.g. movement, location, and spin rate) really only gives us insight into one dimension in a multifaceted game/player.
This is a plausible narrative, but is there any data on how well opponents have hit Cecil’s curve this year vs. last? The sample sizes would be small, but some data is still better than none.
“is there any data on how well opponents have hit Cecil’s curve this year vs. last?” There probably is!
“The sample sizes would be small, but some data is still better than none.” Not necessarily. A small sample size that presents a statistical significance below a high threshold (e.g. 90%, 95%, 99%) is pretty much the same as working with no data at all because no meaningful conclusions can be drawn from said data.
“A small sample size that presents a statistical significance below a high threshold (e.g. 90%, 95%, 99%) is pretty much the same as working with no data at all because no meaningful conclusions can be drawn from said data.”
Data that has a lower level of statistical significance isn’t useless; it’s just less reliable in terms of how much confidence you can have in conclusions drawn from it.
I don’t see a significant difference in curve location except 3% more curves ending up in the zone high middle (these can be effective if paired with high fastball pitches) and that that more pitches in 2016 are off the left side from the catcher’s perspective (I assume that these may be easier to lay off as they may not look as if they are ever in the zone?). Also did you look at fastball speed, command?
….what KENII said.
http://www.fangraphs.com/pitchfxo.aspx?playerid=2660&position=P&pitch=FA
If you look at the above chart, seems to me his fastball velocity peaked in the second half of last year. He hasn’t quite reached that level this year – not consistently at least. Batters can now sit curve as he can’t blow the heater past them.
That’s my take, as the curveball location looks similar enough to 2015.
The problem is, it’s not luck. Yes, his HR rate is not going to remain 20%, but he was not unlucky to allow this many home runs. The reason he has allowed this many home runs is that he can’t spot his curve, meaning that batters can sit on the fastball. When you’re looking for one pitch, and Cecil can really only throw his fastball in the zone, then it’s easy to hit that pitch hard.
The other issue is that Cecil has just been rocked by RHH. 9 of the 20 hits allowed to RHH have been for extra bases. He’s just not able to get RHH out, a big change from previous years.
Additionally, he really hasn’t been better in the second half. The K rate is up, but so is the BB rate, and he’s allowing even more homers.
I do kind of wonder if his struggles are related to pitching with runners on. In the past he’s actually been better with guys on base, but this year he’s been at his worst with guys on base. So maybe he’s doing something differently with his pitches with runners on base.
While what you’re saying seems plausible, I wonder how well the available data fits the narrative.
3 of the 5 HR he’s allowed have come off a fastball, and I believe a fourth is classified as coming off a sinker. His 2 worst pitches this year via pitch fx are his sinker (228 wRC+) and his fastball (156 wRC+). I mean, they’re hitting the curve a bit more than in the past, but the fastball is what’s getting crushed.
I do wonder how much his splits with runners on/nobody on, are just coincidence, of if he’s doing something different with runners on. But as to the fastball point – since he can’t throw his curves for strikes, it seems like hitters are sitting on, and crushing his fastball.