Micheal Saunders was an All-Star in 2016, which means he had an excellent first half of the season. You may have even voted him in as the final selection to the game. After all, he had a good argument for being on that final selection list; his .298/.372/.551 line was a very respectable number for the lefty hitting left fielder. Since the break, however, he’s been a long way from All-Star caliber at the plate. His slash line as of this writing is .174/.289/.358 in the latter half of the season. It ticked up a little bit with double and a home run in his last two games before sitting with a sore hamstring, so consider that recent boost when looking at a very weak batting line.
So, what’s the difference? It’s a long way from “All Star Selection” to “Not Quite Hitting Your Weight.” Let’s start with a quick look at his plate discipline.
Strikeout and walk rate pre and post All-Star break:
We have more walks, which is good! There are also a lot more strikeouts, which is less good. However, this doesn’t suggest Saunders has gone “Swing Crazy” trying to get the results he had in the first half.
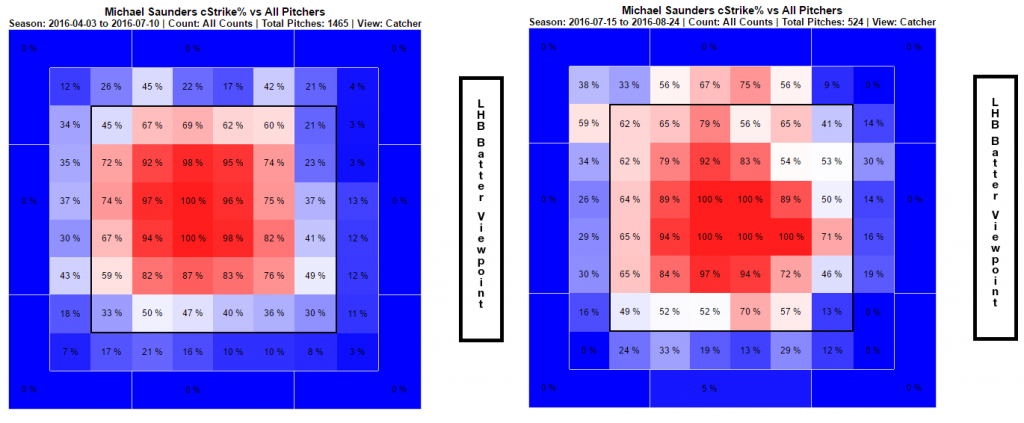
Let’s move on to whether the strike zone itself has changed between halves, these are called strikes as seen from the catcher perspective.

So the zone has expanded significantly at the top, and in fact, a whole lot around the edges. You have to squint a little bit here, but it’s true. Saunders has to be aware of the inside edge, where 30 or 40% of the time there were called strikes, which is now up to 50-70% of the time. His walk rate hasn’t suffered, as we just saw, but the area he has to be ready to cover seems much larger. What impact has this had on where pitchers have been pitching to him?
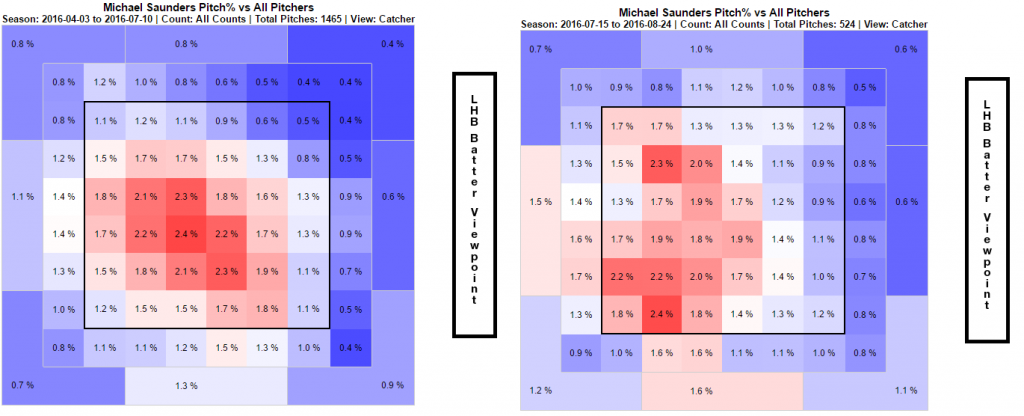
Here are the charts of all the pitches he’s seen both pre and post All-Star game:
Ah, We’ve definitely got something here. We can see pitchers have learned that they can be successful by going to the low outside corner to stay away from Saunders’ power, and still get enough called strikes. As a result, he has to be conscious of that area of the plate. All the red zones have shifted at least one zone division away from him, and even crept outside the zone. Don’t forget, though, that upper part of the zone has had more called strikes as well, so he’s having trouble covering those pitches at the same time as the group on the outside corner. Now I’m not suggesting that umpires have it in for Mr. Saunders. The strike zone, despite the best efforts of MLB to control it, does often undergo size and shape changes throughout the season. I haven’t see enough data on 2016 to know what conclusion to draw here.
Whether it’s a trend, or just a personal vendetta doesn’t really matter here. Saunders is dealing with more called strikes, so what happens when the left fielder has a bigger zone to cover, and the same sized arms and bat with which to cover it?
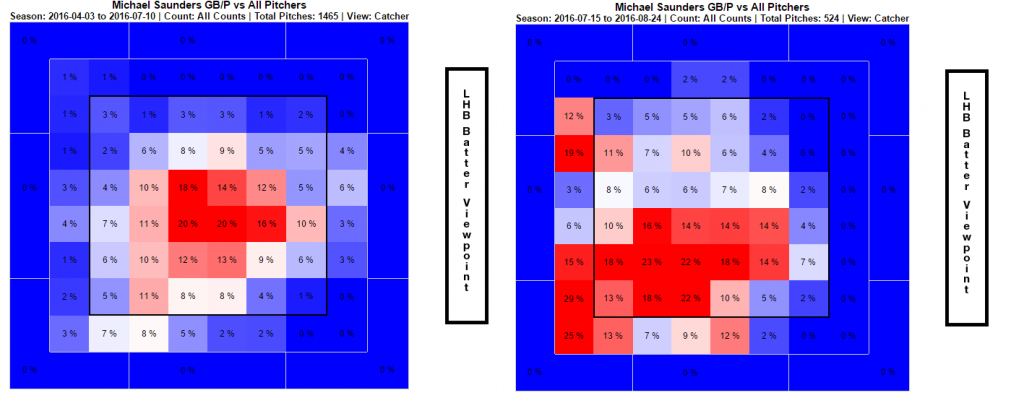
The answer is soft contact. Let us contrast the contact quality in the two halves of the season.
“Blergh”, I say under my breath. All that “Hard” contact is moved in an almost picture perfect fashion into the “Soft” column, and there with it go extra base hits. What does that look like on a heat map?

It looks like a guy reaching out over the plate and rolling over on ground balls. Michael absolutely has to cover the outer portion of the plate, but it’s even more critical now that he not expand the zone beyond what pitchers are already getting called. They have seen him pounce on inside pitches in his new, dinger friendly ballpark, and they have adjusted accordingly. He has a very tough adjustment to make in return, but a 16.1% walk rate in July shows he has the ability to be disciplined and in control of as much as the zone as umpires will afford him.
Lead Photo: John Hefti-USA TODAY Sports
Heat maps courtesy of Fangraphs.


Without seeing any data, I’d have said his issues mainly stem from a combination of being pitched away more and trying to pull the ball anyway rather than adjusting his approach to how he’s being pitched. The first part seems to be so. Any indications as to whether the latter is accurate or not?
That’s the part I can’t be sure about. He’s certainly hit a couple of opposite field homers later in the season, but it can be difficult to have your eyes in two places at once.
Has there been a change in the way teams shift against Saunders as well? Until just recently, I noticed they had a huge shift to the right, but Saunders actually bunted for a base hit in one game, and lined a double into left in another, and the defenses rotated a bit to the left, but not much. If he’s facing a more pronounced shift now than he was in the first half, it might take away some hits. However, I am appalled that Saunders has not seen that he’s been pitched AWAY, and played to PULL, and not made much of an adjustment.
His walk rate is not over twenty percent. I think there’s a mistake in your first take.
Ugh *table
Yes K% and BB % seem to be reversed in the table.