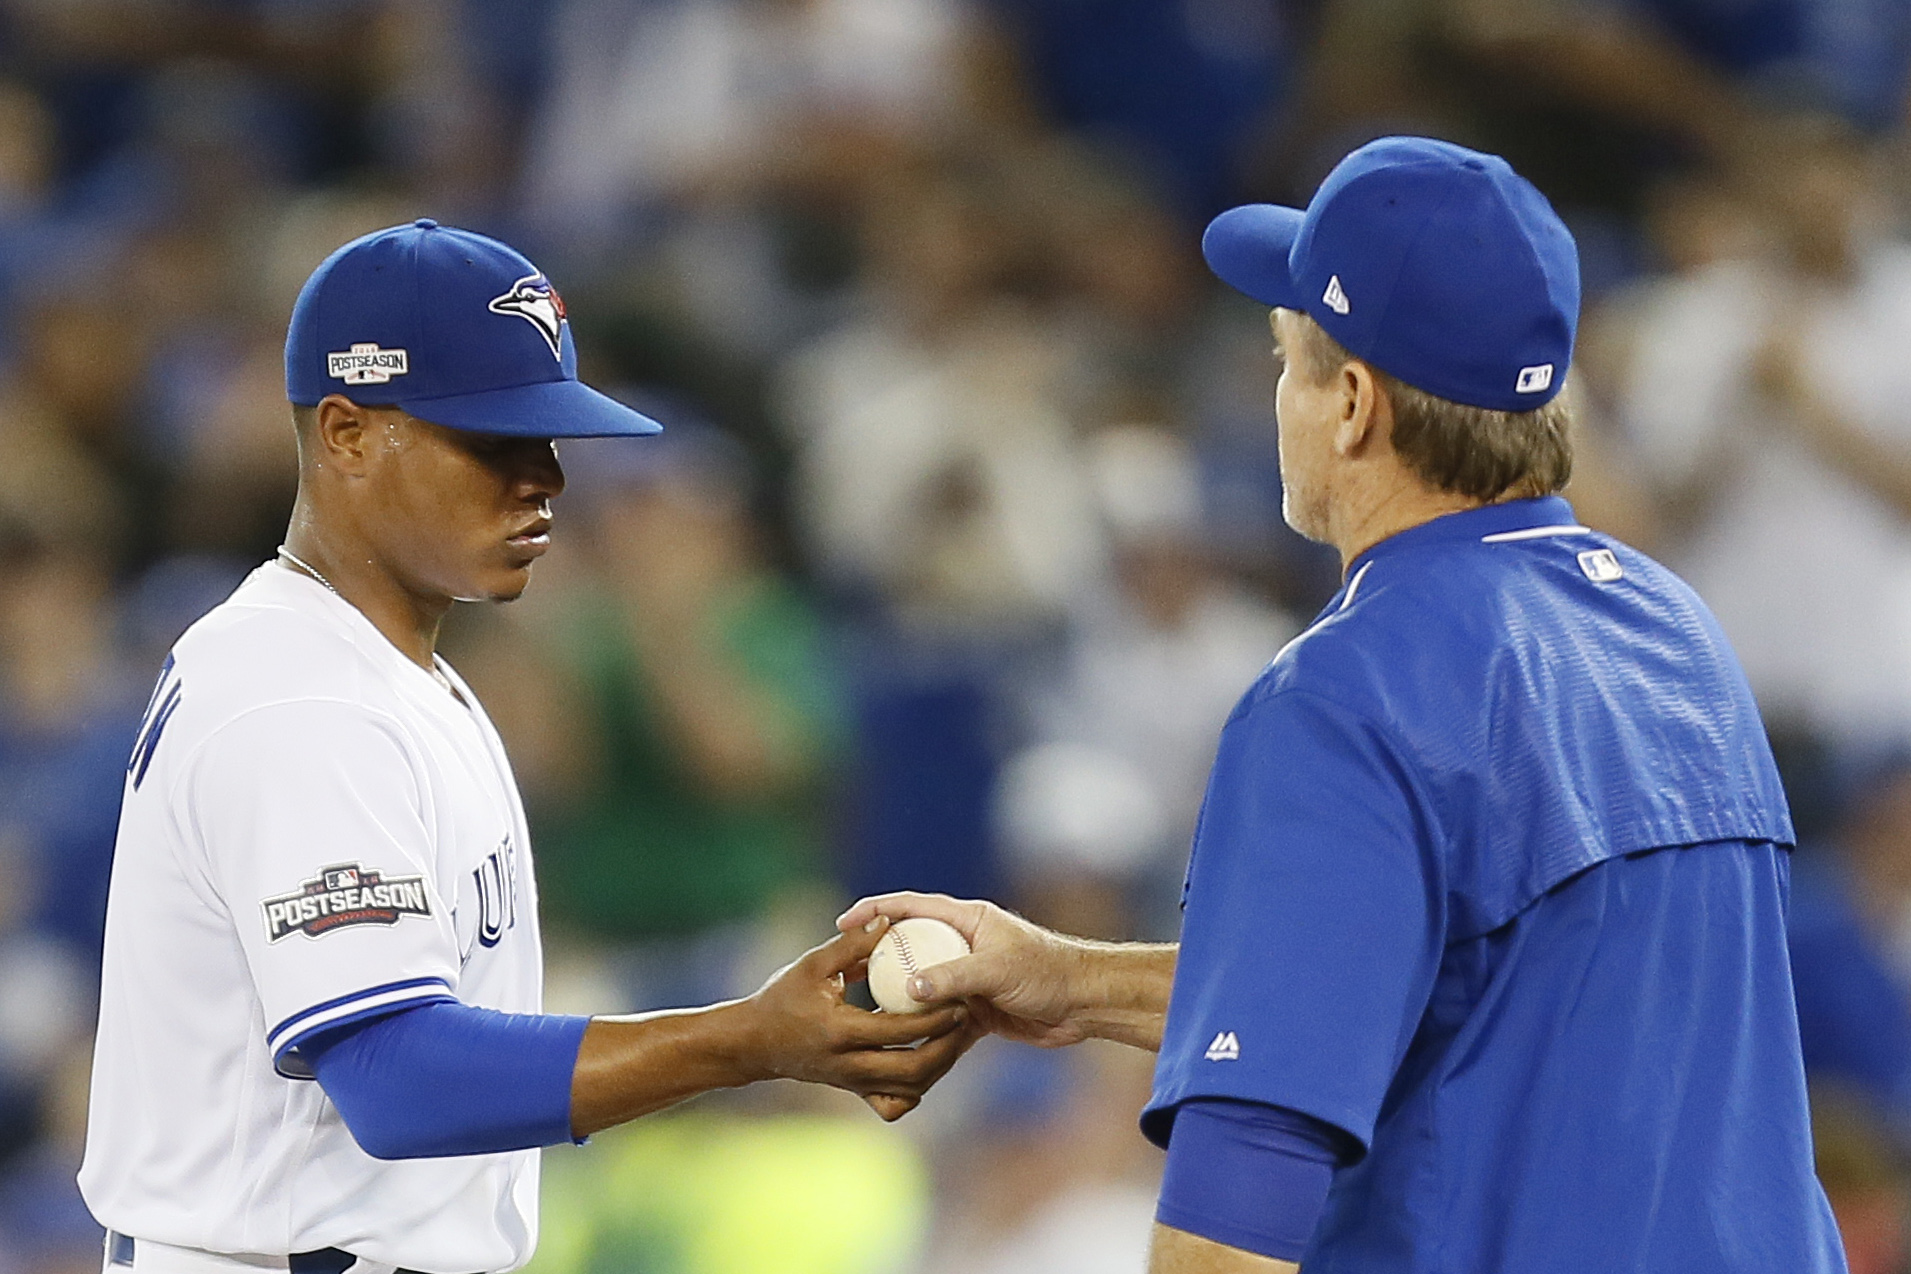
Recently my friends Nick Dika, Joshua Howsam, and Greg Wisniewski were discussing the third time through the order effect on the season recap episode of the Artificial Turf Wars Podcast.
While Nick and I typically keep our conversations to what beer we’re going to order next, and how can we split four pounds of wings without people judging us, occasionally I like to bug him with my science talk. It appeared to work on Nick, because he started talking about the fact Marcus Stroman has the second fastest pace of all MLB pitchers. Pace, as I have written about before, has a strong relationship with predicted fatigue in pitchers (Figure 1). This was also the rationale I used to rally against the MLB implementation of pitch clocks. Nick hypothesized that it isn’t the fact that Stroman’s opponents adjust to his style on the third time through the order that causes his late game struggles, but that he becomes more fatigued due to his fast pace.
Figure 1. Predicted muscle fatigue during 15 pitch innings, with varying paces between pitches.<
The rest of the ATW podcast crew mentioned they wanted someone smarter than them to see if there was any merit to this claim, and sorry guys – but you get me instead.
Methods
I wanted to take a look at the change between first and third times through the order in starting pitchers, so I downloaded the data set that Garrett Chiado posted on the Sabermagician website. Garrett calculated the change from the first time through the order to the third time through the order, for the outcome variables of chase rate, contact rate, swinging strike rate, contact %, swinging strike rate, whiff rate, walk rate, FIP, strikeout rate, and wOBA. From Garrett’s article, for FIP, wOBA, OPS, BB%, and Contact%, a lower difference means better performance later in the game, and vice versa for K%, Chase%, F-Strike%, SwStrk%, and Whiff%. Garret had taken the averages for all of these variables over the 2012 to 2015 seasons.
Next up, I pulled the Pace data from the 2012 to 2015 seasons from Fangraphs. I took the average for each starter who appeared in all three seasons. This left us with a total of 115 different pitchers. For the entire group, the average pace was 21.9 ± 1.7 seconds.
To examine the relationship between the changes in these variables and pace, I used a Pearson’s correlation coefficient. With an n of 115, the r value had to be greater than 0.17 to be statistically significant. I also looked at the mean change in the outcome variables of those who were above and below the median pace.
Results
Table 1. Pearson’s Correlation Coefficients (r) between Pace and Outcome variables. An r value of greater than 0.17 was statistically significant.
Figure 1. Correlation between Pace and outcome variables (all results statistically significant p< 0.05).
Figure 2. Change in outcome variables for pitchers with a pace faster, or slower than the median pace (22.6 seconds).
From all of the outcome variables measured, contact rate, whiff rate, walk rate, and K% were significantly correlated with Pace. Faster paces were associated with significantly greater change in contact rate, and lower changes in Whiff rate, walk rate, and strikeout rate (as seen in figure 2). So, the bad changes in performance were associated with faster paces, for the contact rate, whiff rate, and K%. That being said, the effect sizes and strengths of correlation were very small. While these were statistically different, the effect was so small that it’s unlikely these changes were manifest in something noticeable on the field.
Conclusion
So, in conclusion – the Artificial Turf Wars dudes were on to something! There were statistically significant results for faster and slower pitchers, on the third time through the order. However, these results were not very strong, so while it may help a little, sadly Marcus Stroman’s struggles the third time through the order do not appear to be fixable merely by asking him to take his time.
Lead photo: John E. Sokolowski-USA TODAY Sports


Are there pitchers who slow down as they go deeper into games? And if so, how do they compare vs. those who don’t?
Good question – but a tough one to answer. A lot of things will compound the pitcher’s pace when they get deeper into games. If they are more fatigued after the earlier innings, they will lose command and they will lose velocity. This can lead to more hits and walks – and more runners on base. When there are more runners on base, the pitchers will slow down. This may not be because they’re mitigating fatigue, but because of a strategic approach.
I kind of expected the things you said before I asked my question. I suppose that at the core of it, I wonder how much using average pace across both bases-empty and men-on situations might mask or distort how fatigue affects pitchers. For instance, do we know if some pitchers take less time early and slow down gradually as the game goes on vs. keeping the same pace in the same situations throughout? Would such pitchers show different fatigue effects even if the have the same average pace?