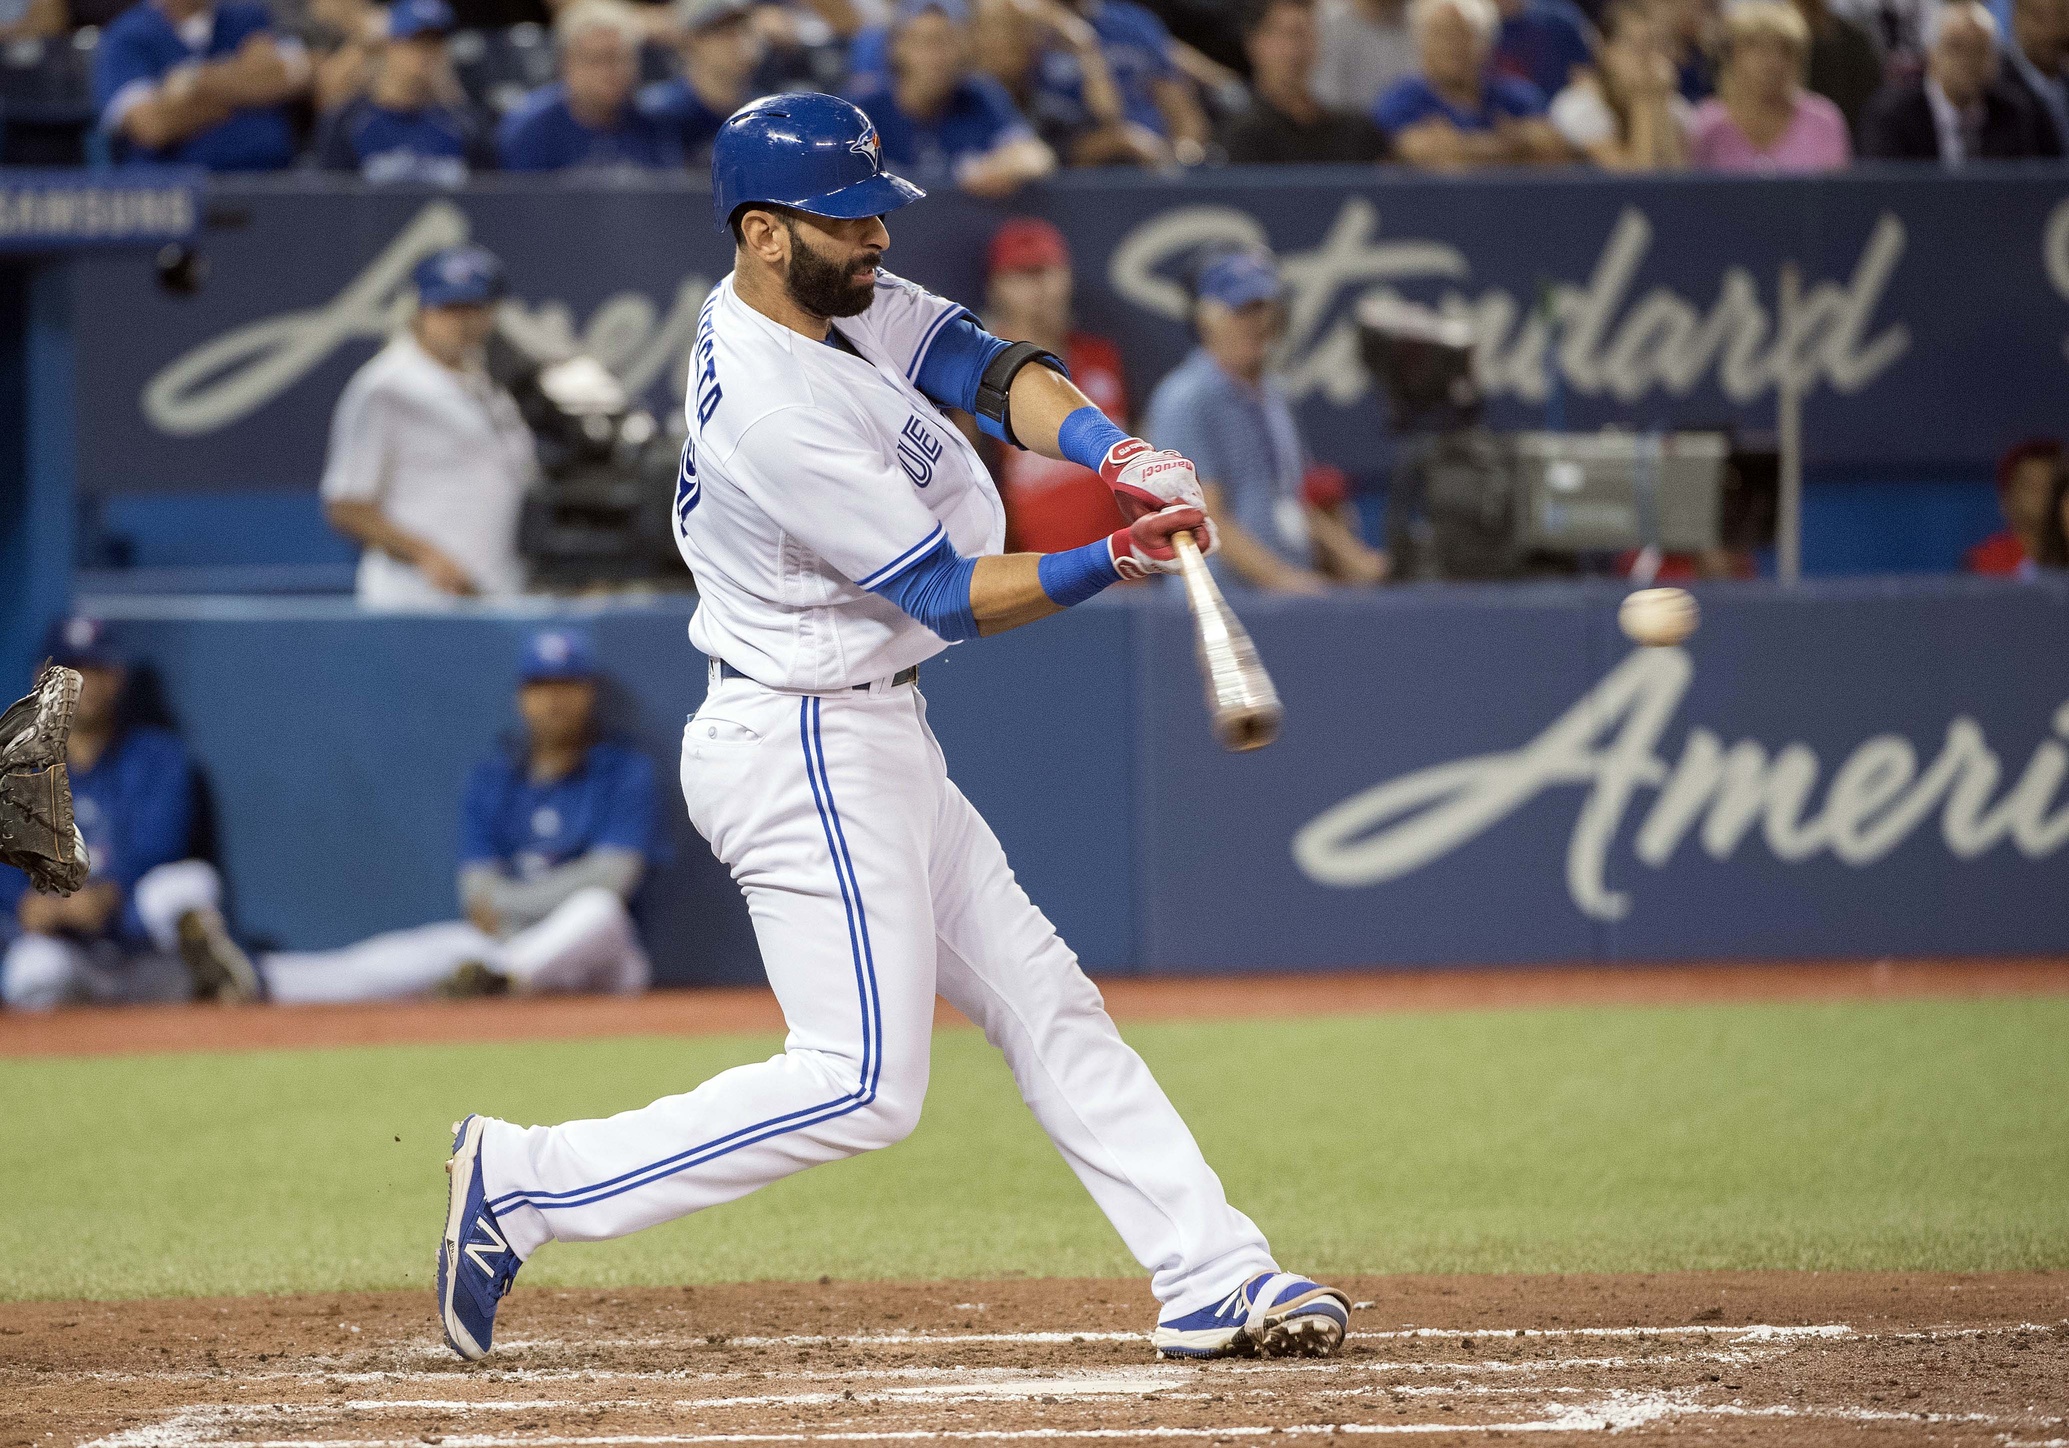
It’s an commonly referenced baseball saying. It puts into words a kind of instinctive perception about hitting. The harder you make contact, the better shot you have of getting a hit. It acknowledges something that some traditionalists don’t really want to admit: The hitter can control the amount of effort he puts into contact, but he doesn’t have a lot of say in where the ball goes after it leaves the bat.
With the introduction of Statcast to the MLB database, we are now able to chart out the ‘exit velocity’ of every baseball that every batter made contact with over the course of a season. This means we have some opportunity to test that old saying out.
I have, with the assistance of someone with more database skills than I have (thanks Mr. Gwin!), pulled up a list of each Blue Jay batter’s hardest hit ball for 2016, and the result of said hit. Congratulations to Jose Bautista, who takes home the trophy this year for his 115.3 mph rocket off of Ervin Santana! He hit it harder than any Blue Jay all year, but Arcia was playing so deep that this registered as a 297 ft single, which sounds a bit silly, if you ask me. So, maybe exit velocity isn’t anything to worry about.
For example, we have a chart here plotting the relationship between batting average and exit velocity, and what have we got?
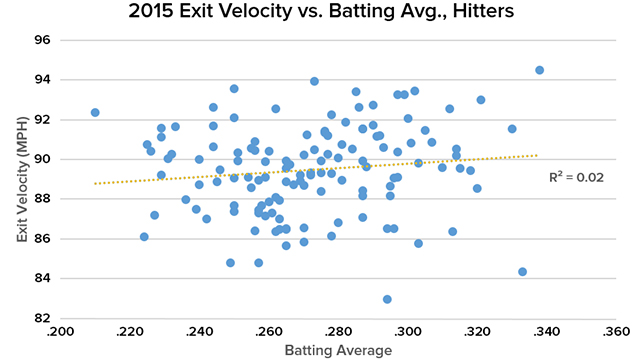
We’ve got… practically nothing. A perfect relationship between exit velocity and batting average would have an R2 of 1.0, but the graph shows .02. That’s because batting average doesn’t tell us enough about the value of a hitter to be useful here. Four singles appear to be worth the same as four home runs, which is, by any reasonable measure, quite silly.
Adding some perspective to batted ball results means we don’t have to throw out the ‘swing hard’ mantra, though. As it turns out, unlike a lot of old baseball sayings, it’s possible to squeeze a little bit of truth out of it. This article from 2015 goes into great depth about the topic. All other things being equal, the harder you hit the ball, the more productive you are likely to be. The graph for wOBA vs exit velocity from the above article looks like this:
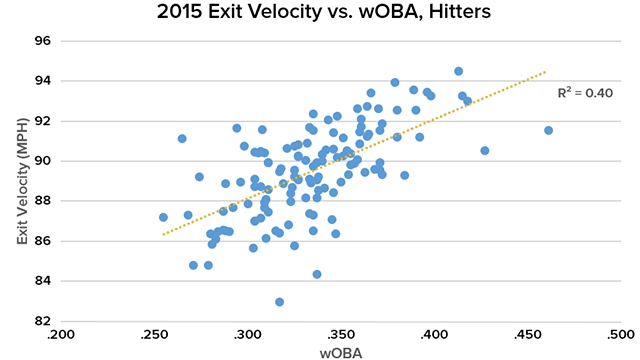
So, we’ve included a value for walks and for power hitting here. The more productive hitters hit the ball harder.
The list that started with Bautista’s 115mph single continues. Going down the standings, Donaldson had a double at 114 mph, Pillar was next with a double at 113 mph.
Instinctively, I can tell you I’m really happy if I know that someone has hit the ball at 110 or more miles per hour. However, I have three hits here, and not a home run among them. Surely the answer can’t be that you have to hit the ball more softly to get a home run? Of course not. Just as looking at batting average doesn’t tell you much about the likelihood of a hit, looking at exit velocity doesn’t tell you much about a home run. We need the trajectory.
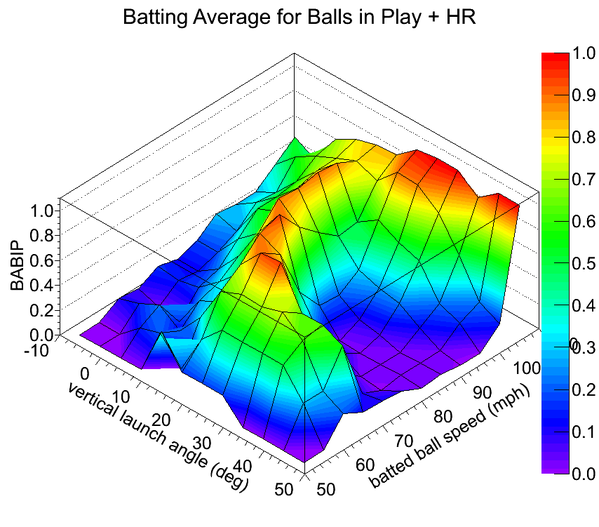
And lo and behold, Statcast is keeping track of that too! As a result of this new exit velocity + launch angle data set, we’ve learned a lot in the past couple of years about what kind of batted ball makes a hit, and there are a lot of people trying to create ways to visualize it. Alan Nathan, for example, has this heat map to demonstrate the places where exit velocity and launch angle are most likely to intersect for a hit.
This graph, nicknamed the “Donut Hole” shows how hitting a ball between 70-90 mph is only a solid proposition if you keep the launch angle low. Over 30% on the vertical angle and it usually ends up hanging in the air long enough for a fielder to catch it. Also, this article talks about batting average and exit velocity and a different way to graph them out.
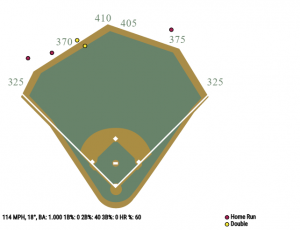
The last tool/visualization I will direct your attention to is the Official Statcast page, which has this nifty little setup where you can click on the velocity and launch angle and see a spray chart for all the results on those situations.
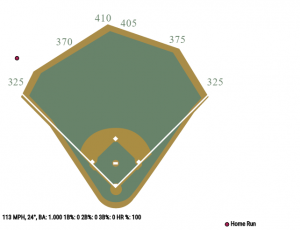
Let’s skip back to the 115.3 mph Bautista single. Checking our data, we see Jose hit this one with a 6.85 degree vertical angle. Putting those into the Statcast tool, we get this spray chart. Only 4 baseballs met that exact criteria all year. Jose got pretty much the result the other three batters did. 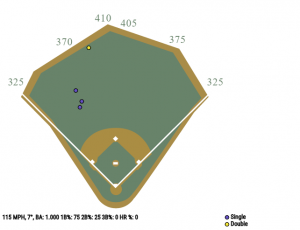
Had he found the launch angle zone of 20-30 degrees that is so magical for hitters, he would have certainly ended up with a monster home run. I checked all the 115mph hits in that ideal launch angle range. Every single one was a home run.
Josh Donaldson, in second with that 114.1mph/17.8 degree double. Not the best of luck there. Similar hits were home runs, although the sample is, again, quite small.
Pillar’s hit was another double, at 113 mph with a 12.5 degree launch angle. That isn’t in the 20-30 degree sweet spot, and the result is short of the wall.
The first home run on the list belongs to Encarnacion, and at 112.8/24.24 he’s exactly where we would expect to find a home run result. This one went an estimated 425 feet as well.
When we rank the list by launch angle, all the home runs clump together exactly as predicted by the big graph, From the Saunders monster bomb at 111.2/25.61 that went 442 feet, down to the Devon Travis 107.3/18.34 that landed 411 feet from home, every home run drops into line. An interesting question about whether swinging for the fences is a matter of technique is covered by Dr. Nathan with reference to the great Ted Williams. That link is also the origin of the Donut Hole heat map I displayed earlier.
Now, before I leave you with the data, just for fun, we should to look at the outliers.
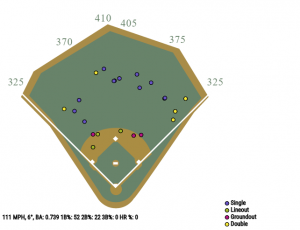
Number one- Troy Tulowitzki. If there was a hard luck batter on the 2016 Blue Jays, I would have to say it was Tulo. My memory isn’t perfect, but I remember a lot of baseballs finding fielders when it seemed like they should have fallen for hits. As a result, it’s fitting that his hardest hit ball was an out. In the same game in which Saunders hit the 111 mph home run, Tulo also made contact at 111 mph, and at a 6.44 degree launch angle, he lined it to Eduardo Nunez. Players hit .739 on this EV/LA combo this year. Not Tulo.
Number two- Aaron Sanchez. Yes, we still let pitchers hit, just often enough to embarrass themselves, really. Sanchez had the hardest contact of any member of the pitching staff, at 104.6 mph. Hitting it a -8.12 degrees means that he ended up with a groundout to second. Sanchez groundout was harder than any ball hit by position players Darwin Barney, Dioner Navarro, and Andy Burns though, so that’s something.
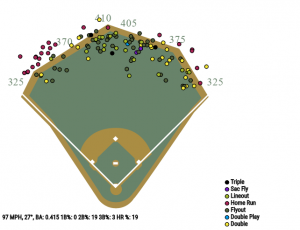
Number three- Marcus Stroman hit a ball at one of the sweet launch angles, 27.09 degrees. Unfortunately, he only put 96.8 mph of charge into it, and Denard Span was able to retire him. Batters hit .415 this year doing what Stroman did, but it didn’t work out for him.
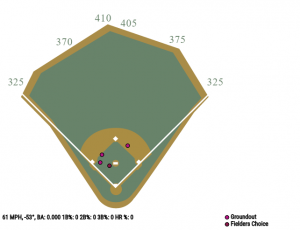
Number four- Poor Gavin Floyd. They make starting pitchers hit rarely, but relievers like Mr. Floyd are almost never called upon to do so, even in the national league. As a result, his effort in his only PA is what we would have to call “pathetic” at 61.2 mph off the bat, and -52.54 degrees.
I’m not sure it’s going to make him feel better, but the dot for “Fielder’s Choice” on that same spray chart was from Edwin Encarnacion, so it can happen to anyone.
Next year, as Exit Velocity creeps into more and more baseball articles and broadcasts, remember it’s sibling, Launch Angle. Hitters are trying to find that sweet spot, and are now able to check how their technique matches up with their results. Feel free to take a look a the hardest hit baseball from all your favourite Blue Jays. Like Jimmy Paredes.
| Date | Player | Distance | Exit Velocity | Angle | Result | Description |
|---|---|---|---|---|---|---|
| 2016-05-09 | Aaron Sanchez | 144 | 104.5999985 | -8.119999886 | Groundout | Aaron Sanchez grounds out, second baseman Joe Panik to first baseman Brandon Belt. |
| 2016-06-15 | Andy Burns | 345 | 95.30000305 | 33.99000168 | Flyout | Andy Burns flies out to center fielder Odubel Herrera. |
| 2016-04-12 | Chris Colabello | 139 | 104.0999985 | -0.850000024 | Grounded Into DP | Chris Colabello grounds into a double play, shortstop Didi Gregorius to second baseman Starlin Castro to first baseman Mark Teixeira. Troy Tulowitzki out at 2nd. |
| 2016-09-04 | Dalton Pompey | 86 | 103.6999969 | -12.52000046 | Groundout | Dalton Pompey grounds out, third baseman Evan Longoria to first baseman Brad Miller. |
| 2016-08-12 | Darrell Ceciliani | 376 | 111.8000031 | 16.37000084 | Double | Darrell Ceciliani doubles (1) on a line drive to right fielder George Springer. |
| 2016-07-20 | Darwin Barney | 278 | 103.3000031 | 0.720000029 | Single | Darwin Barney singles on a sharp ground ball to center fielder Michael Bourn. |
| 2016-07-30 | Devon Travis | 411 | 107.3000031 | 18.34000015 | Home Run | Devon Travis homers (7) on a fly ball to left center field. |
| 2016-08-31 | Dioner Navarro | 214 | 98.90000153 | 14.43999958 | Single | Dioner Navarro singles on a sharp line drive to right fielder Mark Trumbo. |
| 2016-09-06 | Edwin Encarnacion | 425 | 112.8000031 | 24.23999977 | Home Run | Edwin Encarnacion homers (37) on a line drive to left field. |
| 2016-07-05 | Ezequiel Carrera | 415 | 106.9000015 | 22.94000053 | Home Run | Ezequiel Carrera homers (4) on a fly ball to right center field. |
| 2016-05-11 | Gavin Floyd | 52 | 61.20000076 | -52.54000092 | Groundout | Gavin Floyd grounds out softly, third baseman Matt Duffy to first baseman Brandon Belt. |
| 2016-06-16 | J.A. Happ | 304 | 92.09999847 | 14.35000038 | Single | J. A. Happ singles on a line drive to center fielder Odubel Herrera. |
| 2016-05-18 | Jimmy Paredes | 137 | 107 | 3.160000086 | Groundout | Jimmy Paredes grounds out, second baseman Tim Beckham to first baseman Logan Morrison. Justin Smoak to 3rd. Troy Tulowitzki to 2nd. |
| 2016-05-19 | Jose Bautista | 297 | 115.3000031 | 6.849999905 | Single | Jose Bautista singles on a line drive to left fielder Oswaldo Arcia. |
| 2016-04-27 | Josh Donaldson | 395 | 114.0999985 | 17.79999924 | Double | Josh Donaldson doubles (8) on a sharp line drive to center fielder Austin Jackson. |
| 2016-05-16 | Josh Thole | 176 | 105.5999985 | 10.88000011 | Single | Josh Thole singles on a sharp line drive to center fielder Steven Souza Jr. |
| 2016-07-20 | Junior Lake | 308 | 108.1999969 | 12.10000038 | Double | Junior Lake doubles (3) on a sharp line drive to right fielder Yasmany Tomas. Junior Lake out at 3rd, right fielder Yasmany Tomas to second baseman Jean Segura to third baseman Jake Lamb. |
| 2016-05-16 | Justin Smoak | 232 | 110.1999969 | 6.150000095 | Single | Justin Smoak singles on a sharp line drive to left fielder Desmond Jennings. |
| 2016-05-03 | Kevin Pillar | 384 | 113 | 12.53999996 | Double | Kevin Pillar doubles (7) on a line drive to left fielder Ian Desmond. |
| 2016-06-15 | Marco Estrada | 110 | 70.30000305 | 11.77999973 | Lineout | Marco Estrada lines out to first baseman Tommy Joseph. |
| 2016-05-11 | Marcus Stroman | 368 | 96.80000305 | 27.09000015 | Lineout | Marcus Stroman lines out to center fielder Denard Span. |
| 2016-04-27 | Matt Dominguez | 310 | 105 | 14.22000027 | Lineout | Matt Dominguez lines out to left fielder Melky Cabrera. |
| 2016-08-21 | Melvin Upton Jr. | 430 | 107.5 | 23.23999977 | Home Run | Melvin Upton homers (19) on a line drive to left center field. |
| 2016-05-21 | Michael Saunders | 442 | 111.1999969 | 25.61000061 | Home Run | Michael Saunders homers (8) on a fly ball to right center field. |
| 2016-09-15 | Russell Martin | 391 | 110.6999969 | 21 | Home Run | Russell Martin homers (19) on a line drive to left field. Josh Donaldson scores. Jose Bautista scores. |
| 2016-04-23 | Ryan Goins | 150 | 107.8000031 | 6.119999886 | Groundout | Ryan Goins grounds out, second baseman Jed Lowrie to first baseman Billy Butler. |
| 2016-05-21 | Troy Tulowitzki | 139 | 111.0999985 | 6.440000057 | Lineout | Troy Tulowitzki lines out to shortstop Eduardo Nunez. |
Lead Photo Credit Nick Turchiaro-USA TODAY Sports
