Statcast is the new shiny toy of on field analysis, owned by major league baseball. It’s responsible for the sudden jump in the terms ‘exit velocity’ and ‘route efficiency’ and has made work for the fancy graphics people at Fox and TBS, allowing them to track player movements a ball flight in ways that simply were not possible before it was installed in all of the MLB ballparks.
This is all pretty cool. In fact, I’m in love with Statcast and it’s potential. That is why my interest was piqued when Mike Petriello tweeted about a new Statcast metric – Barrels. Now, rather than explain how they created the new metric, I will link you to the article which explains it in great detail. If you’re not inclined to read the whole thing, I have no time to explain, so I will sum up; ‘Barrels’ are balls put in play where you will have a minimum .500 BA and 1.500 SLG. Statcast combs through all of the balls put in play this year to find the velocity and launch angle that create that very favourable result.
What we get is a list of batters who put the ball in play with utmost authority – those with the highest total number of Barrels. Like a home run leaderboard, this has a lot to do with how many plate appearances a player receives to try to barrel one up. In addition there are two rate base statistics related to Barrels: percentage of barrels per batted ball event (Brls/BBE, and percentage of barrels per plate appearance (Brls/PA). The first is a measure of how often players barrel up the ball when they manage to hit a fair ball, measuring their talent in the raw sense. Brls/PA puts it in the context of how effective they are at getting it barreled up at the expense of striking out or being walked. There is a minimum exit velocity required to get into the ‘Barrel’ zone, and some players whiff too often to make their solid contact valuable.
So, if we set the threshold to just 100 BBE, the most effective Barreller in MLB for 2016 is Yankees Rookie phenom Gary Sanchez, at 18.8 percent, followed closely by Byung Ho Park, at 18.7 percent, the Twins’ big pre-2016 Korean signing. The fact that Park has been outrighted to the Rochester Red Wings tells us that Brls/BBE doesn’t show us everything about a successful MLB hitter. If we look at Brls/PA, our leaders are Khris Davis (10.7 percent) and Miguel Cabrera (10.6 percent), which feels more like the start of a list of hitters with a specific kind of talent.
You didn’t come here for Khris Davis news, though, did you? I thought not. Let’s turn our sights on the Blue Jays, both the familiar faces and the new kids in town, and see how they stack up against one another.
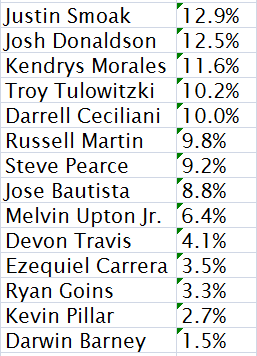
First, let’s see the Barrels on Batted Ball events:
Well look at that. Justin Smoak. The perpetual hitting prospect really does have the ability to make the most solid sort contact. Somewhere, in some way, the thing all the scouts have seen over the year is measurable. It’s also nice to see MVP candidate Josh Donaldson up at the top. This list also suggests that Kendrys Morales hits the ball very hard, and that might be one of the things that made the Jays jump early at him as “Plan B” when it looked like Encarnacion was going to command a high price.
Down at the bottom of the list we have Darwin Barney, who also passed the eye test when it comes to hitting without any authority at all. Somewhat more distressing is the presence of Kevin Pillar, who doesn’t clobber anything despite swinging at everything. The other notable on this list is Joe Bautista who, frankly, I would have hoped had a more effective power approach than Russell Martin. If we roll back the clock to 2015, Jose does in fact show himself to have that ability to make contact with authority. His Brls/BBE was 16.8 percent two years ago, good enough for ninth in the league. Comparing the 2015 and 2016 leaderboards reveals a very different environment for hitters overall. It also, if you’re a fan of a certain Miami Marlins slugger, reveals the real Barrel King of MLB. Barring injuries, of course.
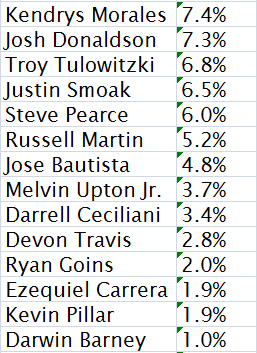
Moving back to the Blue Jays, and back to 2016, we can look at Barrels a different way. When put into the context of all PA, we must remember that the numbers will be suppressed by large numbers or strikeouts and large numbers of walks.
Kendrys comes up as a big winner again! What that means is you should expect a lot of baseballs driven with authority off of Mr. Morales’ bat this year. It also suggests a lot of well-hit balls put into play overall. Smoak drops to fourth in this category because he struck out 32 percent of the time in 2016, which sucks the value right out of those times when he does strike it solidly. If you’re feeling like Darwin Barney is pitiful, you might take some consolation that he barreled up the ball more frequently than Dee Gordon, Adeiny Hechavarria, Ichiro Suzuko, Ben Revere, and (wait for it) Aaron Hill, among others. So he’s got that going for him.
We can again observe a truly lackluster number beside Jose Bautista’s name. If we once more take a look back to 2015, Jose turned in a healty 9.6 percent in this category. That was good for seventh in the league! He was just behind…Justin Smoak.
Okay, so what’s really going on here? We have a new way of looking at batted balls. We have a list of players, in each year who hit balls in a way that should produce a specific kind of positive result. It’s a process based stat, meaning we don’t care what happened to any specific ball that was hit, we just care how often the player was able to execute and get the ball in the air according to specific velocity and angle criteria. On the whole, it passes the smell test. We have big power hitters with uppercut swings at the top of the list. We have slap hitting infielders at the bottom. What we also have is wild variations. The top five guys on the 2015 list change completely on the 2016 list. Except Chris Davis. And that’s purely a technicality as it’s actually Khris Davis on the 2016 list. The real issue here is we have only those two years of data to draw from.
These new numbers are fun, but either we don’t have a large enough sample size to see a real trend, or this is not a hitting skill at all but a random variation in lucky swings. I lean to better number crunchers than I am to keep digging as the database grows and to see if a pattern truly begins to emerge with this type of hard contact. In the meantime, I can hope that Kendrys Morales keeps on barreling them up like 2016 and that Jose Bautista gets back to the way he was doing it in 2015.
Check in with Statcast and Baseball Savant through the year, like I did when looking up the data for this article, they are always looking for new ways to illustrate what they find in these mountains of data.
Lead photo Credit: Peter Llewellyn-USA TODAY Sports


I wonder why there’s only a per PA rate stat instead of both per PA and per AB which would make it much simpler to see the effect of walk rate.