The closer debate began the moment the Blue Jays traded for Drew Storen back in January, and the embers of the competition were stoked throughout the full duration of camp. It wasn’t until March 30th that manager John Gibbons made the announcement that Roberto Osuna had won the battle and would continue the role in which he dominated for the final four months of 2015. The public reaction to the announcement was fairly evenly split, as while just about everyone agreed that Osuna was the better of the two pitchers, those on “Team Storen” were envisioning the 21 year old flamethrower pitching in the highest leverage situations possible – which often occur in the seventh and eighth innings – with Storen earning the less impactful “saves” in the ninth. This leverage hypothesis has since been confirmed, as you’ll see shortly.
Six weeks into the season, it’s inching towards laughable that there was ever a closer battle to begin with. Storen hasn’t looked right since his first outing of the year against Tampa Bay, and while Gibbons has repeatedly assured everyone that the right hander is healthy, healthy pitchers don’t often lose three miles per hour off their fastball over the course of an offseason. Storen’s performance has become so unreliable that not only is he completely out of the picture for closing games, he has managed to remove himself from the right handed setup guy conversation, too. Thankfully for the Blue Jays, the February signing of Gavin “I’m only here because my agent is Mark Shapiro’s dad (note: This is in jest)” Floyd has paid off in spades. The oft-injured pitcher has emerged as Gibbons’ second most trustworthy right handed reliever, delivering a breakout that resembles that of last season’s unsung hero (gasp) Liam Hendriks.
Floyd has found his success by evolving his repertoire to better suit his new role. Back in his starter days, he relied upon a balanced, four-pitch arsenal of a four seam fastball, two seam fastball, slider, and curveball, with his changeup serving as a fifth “back of the mind” type offering. Through thirteen relief appearances in 2016, his two seam fastball and changeup have largely been parked, with the four seam fastball and curveball rising to the top as his two primary (and best) offerings. Floyd’s four seam usage has climbed to 40.2 percent – the highest it has been in nine years – while his curveball currently accounts for 32.1 percent of his pitches – more than double its usage rate from last season and well above any other years in which he started.
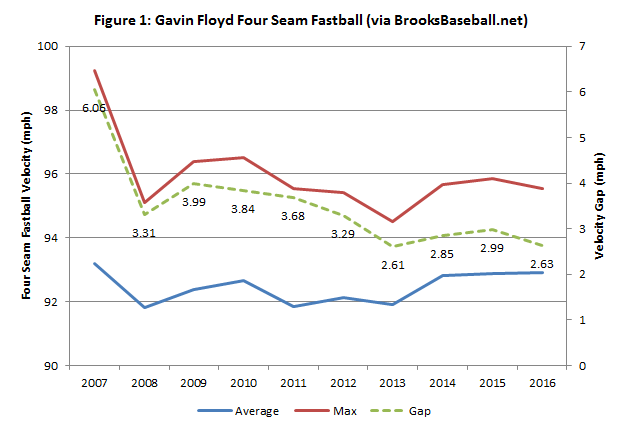
When starters are converted to the bullpen, you often see the fastball velocity tick up a little bit. This has been the case with Floyd as well; he previously averaged around 92 miles per hour, but that mark has jumped up to 93 this season and has been edging upwards towards 94 over the past couple of weeks. One interesting aspect regarding Floyd’s fastball is that the gap between his maximum velocity and his average velocity has closed over the years. This trend is depicted in Figure 1 below, which suggests that Floyd is throwing with something very close to maximum effort on each and every fastball; there’s not a whole lot of “veteran savvy” adding and subtracting going on to mess up timing.
This approach appears to be working, and the reason may be that the lack of a “subtracting” element has been negated by his increased reliance upon the curveball. Whereas his slider and nigh-extinct changeup both average around 87 miles per hour – just five or six miles separated from his fastball – the bender has typically been thrown around 81 mph to create a nice velocity window of twelve miles per hour. Over 72 percent of Floyd’s pitches this season have been thrown at one of these two extremes, which has helped his swinging strike rate climb into legitimately elite company. Among 175 qualified relievers, Floyd’s overall swinging strike rate – i.e. the percentage of all pitches which were swung on and missed – ranks 12th at 16.6 percent, just a hair behind Yankees super-reliever Andrew Miller.
Floyd has thrown 79 curveballs this season. Another 26 relievers have thrown at least 50, bringing the sample to a total of 27 pitchers. Within that group, Floyd ranks 4th in whiff per swing rate at 54.6 percent and 1st in groundball rate at one hundred percent. The former figure is ahead of Dellin Betances and Brett Cecil, to name a few. The latter is somewhat misleading given that just four of his 79 curveballs have been put into play, but at the same time, having batters put 5.0 percent (4/79) of curveballs into play seems equally incredible. For context, in 2015, batters put 12.5 percent (43/345) of Brett Cecil’s curveballs in play, and Brett Cecil’s curveball is insanely good.
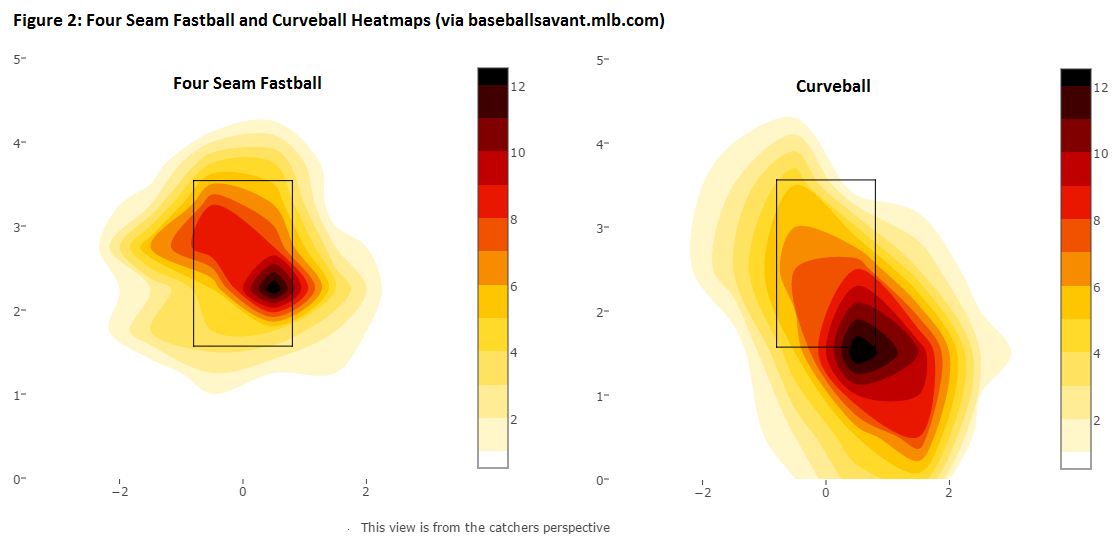
With both his fastball and curveball he has a clear plan of attack, and as Figure 2 above depicts, it’s a complementary one-two punch. Righties get fastballs down and away, and curveballs even further down and away. Lefties get fastballs in on their hands, and curveballs thrown at their back foot. This approach makes the curveball a truly devastating weapon as its break is really only just beginning where the fastball finishes. Thanks to an average spin axis of 47 degrees, the breaking ball has nearly equal vertical and horizontal movement; a true two-plane pitch. Floyd’s pitch usage with two strikes suggests he’s conscious of the vulnerable position in which he’s able to place batters. In those situations he starts leaning heavily on the curveball – its usage climbs to 50 and 46 percent versus lefties and righties, respectively, and has accounted for ten of his eighteen strikeouts.
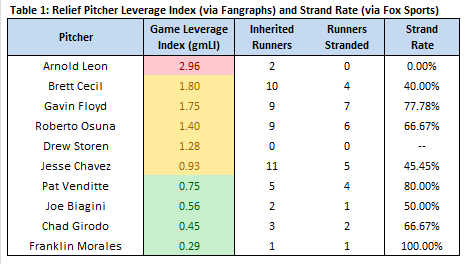
Gibbons has already recognized what he has in Floyd, as the right hander is currently sporting the third highest gmLI (or Game Leverage Index) among Blue Jays relievers. Game Leverage Index is one of the better indicators for the level of trust that a manager has in a reliever, as it represents the average leverage index for the situations when a pitcher enters the game, rather than the average leverage index for all events. Leverage Indexes are scaled to where 2.00 and above is considered “high” leverage, anything below 0.85 is considered “low” leverage, and anything in between those two points is “average” leverage.
The only two pitchers who have a higher average Game Leverage Index than Gavin Floyd are Brett Cecil and Arnold Leon. Cecil being there you would expect, and the two are neck-in-neck at the upper end of average leverage at 1.80 and 1.75. Leon on the other hand, represents one of John Gibbons’ single greatest mistakes of the early season. He brought the team’s seventh best reliever into a situation with a leverage index of 5.50 – a 3-2 lead in the eighth inning, with one out and two runners on – and we all remember how that unfolded. In the only other game Leon pitched this season, he entered with a leverage index of 0.43, but the damage to his manager’s faith was irreparable. In fact, for the Gibbons critics out there, outside of that erroneous Leon deployment, the average Game Leverage Indexes for Blue Jays relievers are pretty close to what you’d hope to see. It would be nice if Osuna were at the very top of the list, but having Cecil, Floyd, Osuna, Storen, and Chavez in descending order as the top five among the regular options is strong. That the non-Osuna and Floyd arms have largely squandered the opportunities thrust upon them is not blame for Gibbons to shoulder.
Table 1 also shows the strand rate for Blue Jays relievers, something that has become a hot topic for obvious reasons. The two pitchers inheriting the most base runners, Cecil and Chavez, have managed to strand fewer than fifty percent, which has cost the team a number of games. Gibbons should shoulder some of the blame here for frequently keeping his starters in too long and seldom giving his relievers a clean slate, but strand rates between 40 and 50 percent are simply inexcusable. That Storen has inherited zero runners and has still been cratered by opposing offenses is damning, and indicative of just how far he has fallen.
Amid this collection of embarrassing strand rates stands Gavin Floyd at nearly 80 percent. He has entered games with nine runners aboard, but has allowed just two of them to come around to score. As summer approaches, expect Floyd’s level of responsibility to mimic the rising temperatures and continue to grow. Roberto Osuna remains unquestionably the best arm in the bullpen, but the unexpected emergence of Gavin Floyd has drastically lessened the sting of Drew Storen’s disaster of debut season.
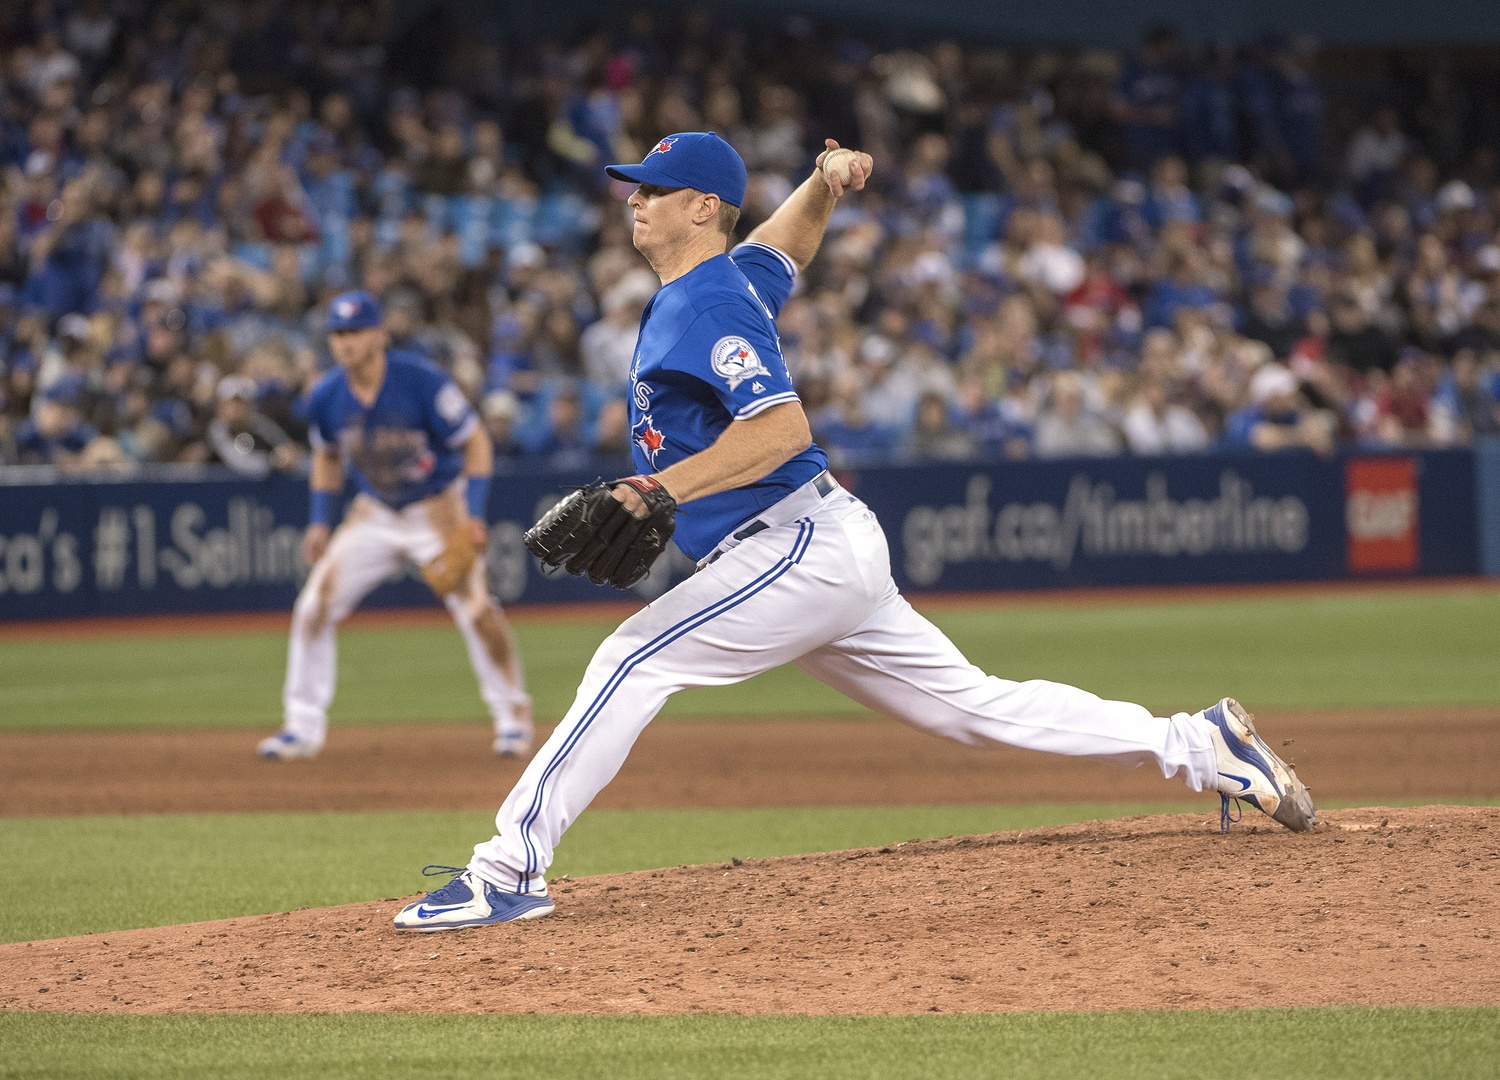
Lead Photo: Nick Turchiaro-USA TODAY Sports


