Marco Estrada had a rough 2017 season. As a pending free agent who had just posted two well above-average season, another good turn would likely have led to a very healthy contract going forward. Instead, after a tremendous start, everything went sideways for the Jays’ hurler. He posted a 4.98 ERA, dealt with personal issues off the field, and ended up signing a one year contract extension with the hope of hitting the market again next year. What went wrong? It was certainly a few things, but most importantly: his bread and butter pitch seemingly abandoned him:
Marco Estrada's wRC+ allowed against his changeup:
2013: 37
2014: 75
2015: 58
2016: 50
2017: 130— Rob Silver (@RobSilver) December 3, 2017
That’s one heck of a disappearing act by one of the game’s best offspeed pitches.
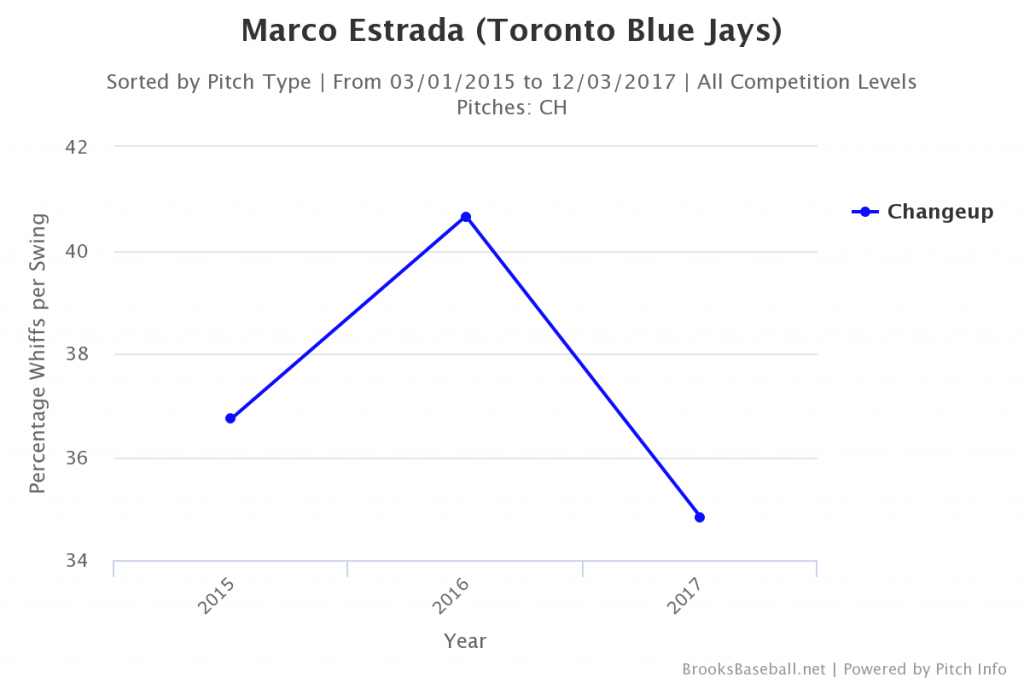
Everything went backwards on the aggregate with the pitch last year. Estrada threw it more often (32 percent in 2017 vs 28.8 percent in 2016 and 27.8 in 2015), but it obviously got hit harder (see above) and his swing and miss rate on the pitch also fell off pretty heavily:
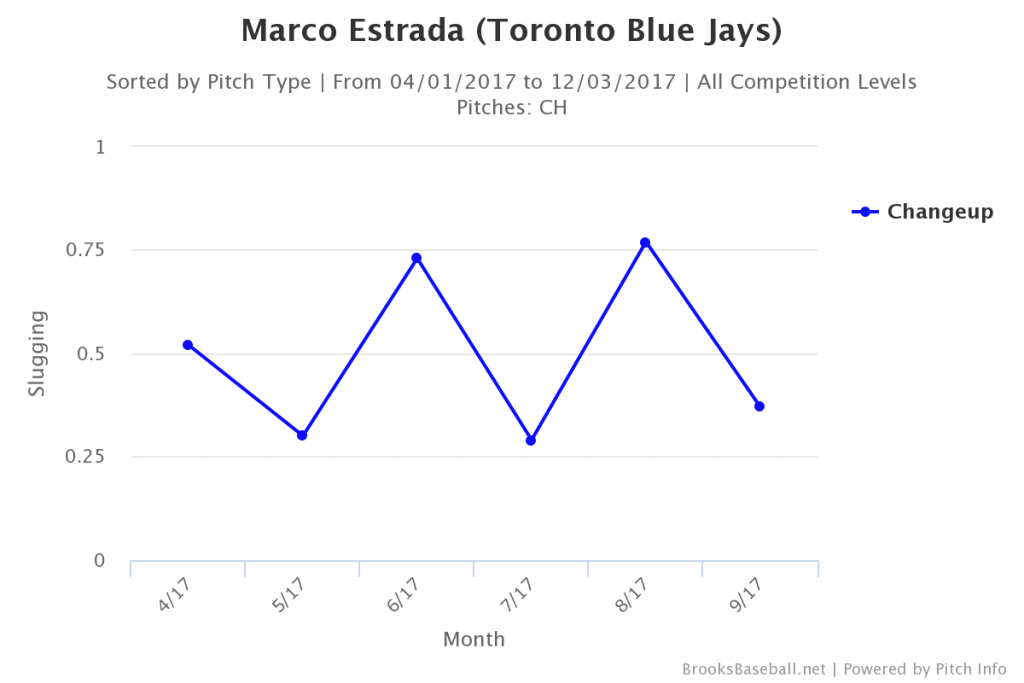
There was obviously something going on there. But as anybody who watched the Toronto season is probably aware, Estrada had a very up and down 2017. The same applies to his changeup:
As you can see, Estrada actually only really struggled with the pitch in June and August, with a bit of a blip in April that happened to be helped along by an unusually stingy fastball. So instead of looking at the season as a whole, we should be looking at those individual months to see what was going on with Estrada’s changeup.
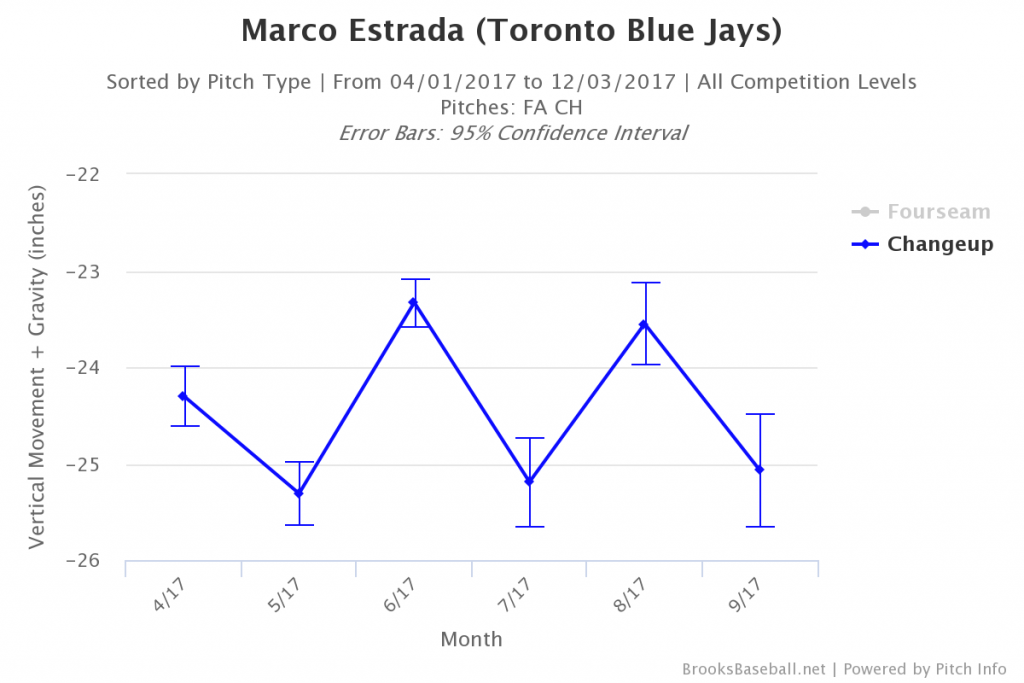
There doesn’t seem to be an issue with the velocity gap between his changeup and his fastball, so that’s not the problem. But when we start looking at the movement on the two pitches, the issue starts to become a bit clearer:
That sure looks an awful lot like that slugging percentage chart above, doesn’t it? It follows reasonably logically. By the time the ball is getting to the plate, there is a two inch variance in where the pitch was ending up (assuming a similar release point). That’s a big difference when we’re talking about a bat that has a 2.61” barrel.
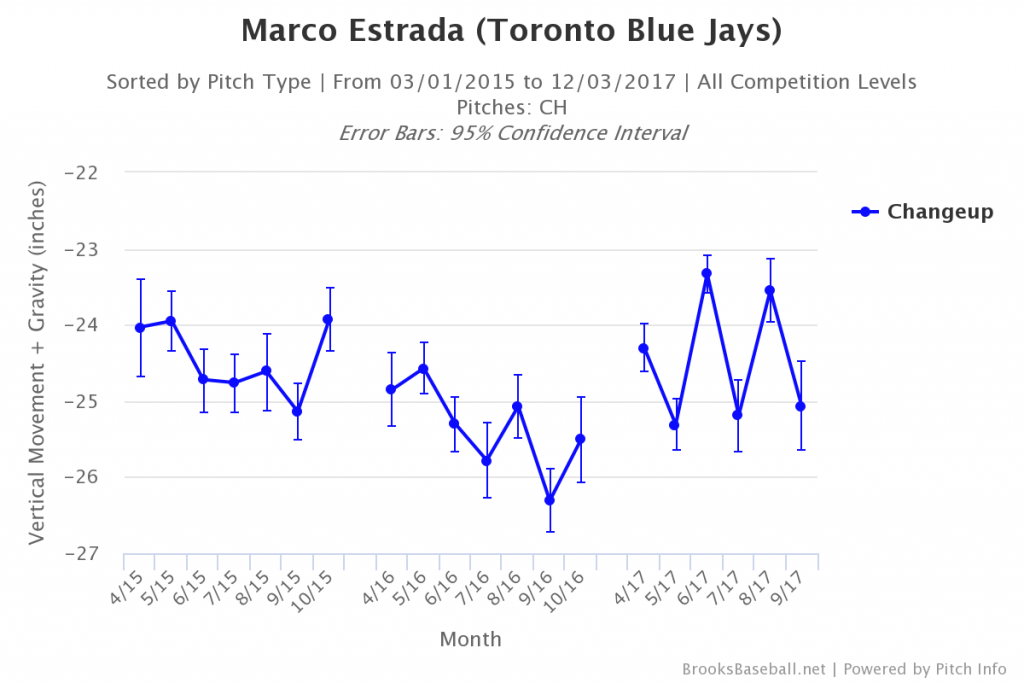
For reference, take a look at the vertical movement (+ gravity) on the changeup over the last two years.
We can ignore the two October readings — as they were both based on a single outing — and see that the vertical movement on his changeup tracks pretty well with the whiff rates on the pitch from that first chart above. Most importantly, all the months with the least amount of “drop” on the changeup occurred in 2017.
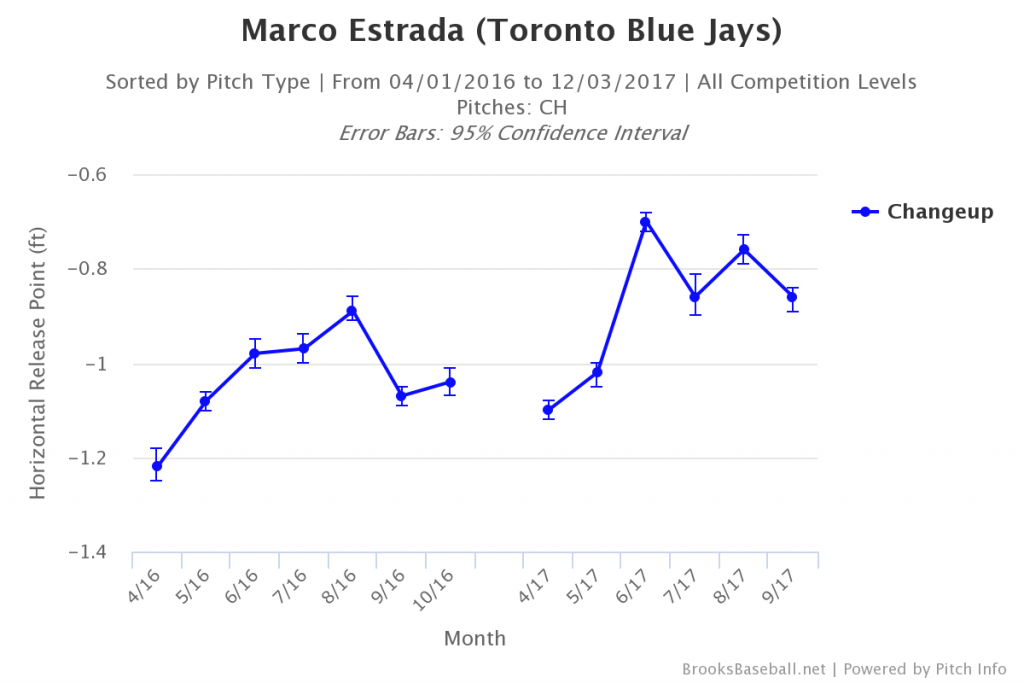
But we’re still talking about the what. What we really need to get into is the why. WHY did Estrada’s changeup get worse? There was no tangible change in spin rate (a difference in average RPM of a mere 29 revolutions, from 2154 to 2125), but there definitely was one in release point.
There’s a substantial difference in where Estrada was letting the ball go this year compared to last; the range there is a whole six inches of release horizontally. But as we said above, Estrada had some good months with the pitch in 2017. He was never getting the whiffs of 2016, but still solid. So let’s focus on 2017.
The two months where Estrada happened to be throwing most over the top completely lined up with the months where his changeup fought gravity at the highest rate. That’s not a coincidence, of course. By coming over the top like that Estrada is changing the spin direction of the baseball. The closer he gets to true backspin, the more the pitch will fight gravity. In the case of his disappearing changeup, that just happens to be a bad thing (though it helps him with his fastball).
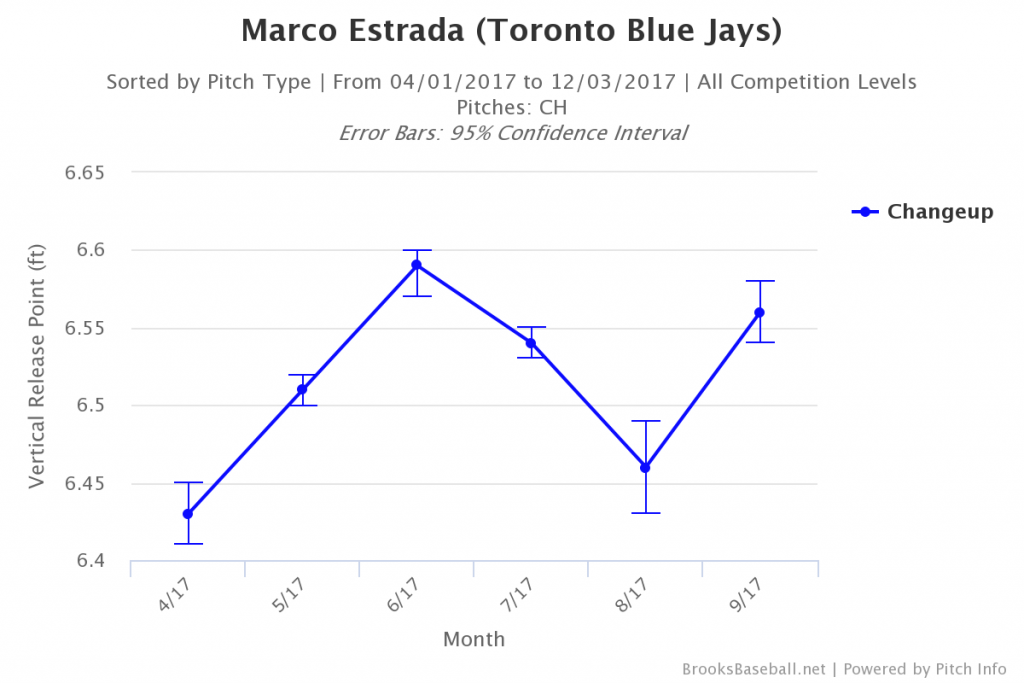
When we look at the vertical release points we catch another issue.
Estrada began tilting a bit in June (and was aware of that, as he told Gideon Turk) which was throwing off his release point. However, in August he had almost an identical vertical release so the one he had in April but with a horizontal release of over four inches closer to the plate. If you’re wondering how that happens:
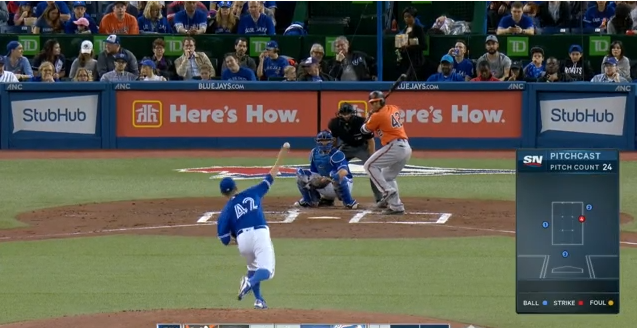
This is a changeup from April.
This is a changeup from August.
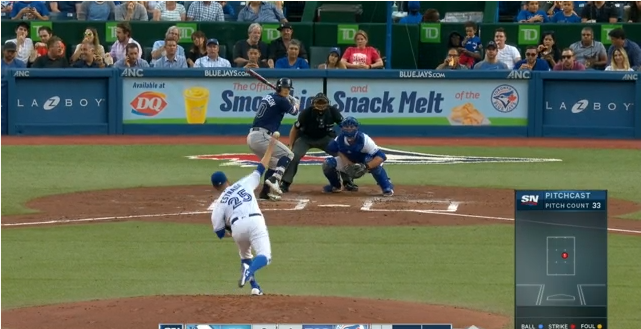
Estrada is really tilting his body in that second photo. If you’re having trouble seeing it, compare the left handed batters boxes in those two photos. In the one from April, there’s a significant, visible gap between Estrada’s shoulder/neck and the line of the box. With no change in position on the rubber in the latter picture, he is almost completely obscuring the box’s outer edge.
These are cherry-picked offerings (we can find occasional examples of each in any start), but they’re also very representative of what the average release point data is trying to show. Estrada was pulling off the ball in August, resulting in lower vertical release (because he was bent over more), but also a release closer to his head. As such, he was still getting that “rise” on his changeup that he didn’t want, despite the lower release point.
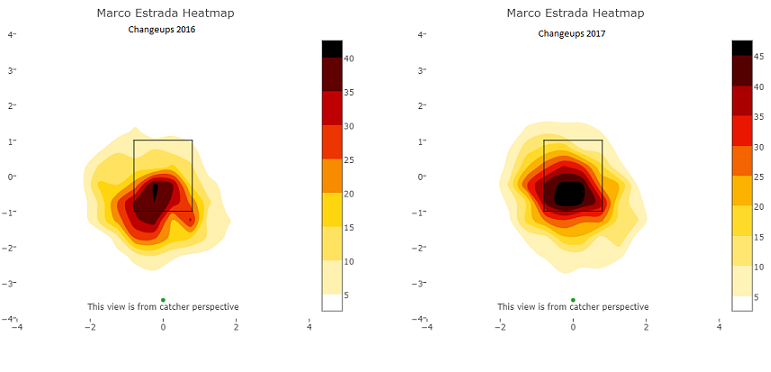
In addition to the problems created by the unusual movement, the constantly shifting release points would have wreaked havoc on Estrada ability’s to command the pitch. Take a look at his Statcast location plots from 2016 vs 2017:
Those two heat maps couldn’t be more different. In 2016, Estrada had a very small area where most of his changeups ended up, with the rest of them radiating down and out of the zone, showing a clear intent. In 2017, the most frequented location is spread over a much bigger area in the middle of the plate, then radiating out in all directions. That’s a visible example of a lack of command. When you’re talking about pitch that relies entirely on deception for its effectiveness, being able to throw it where you want is pretty important. Estrada couldn’t.
So inconsistent movement, inconsistent release, and inconsistent location. Yep, that would add up to a bad pitch.
The obvious follow up, then, is what does all this mean going forward?
Well, the good news is that he is aware of the potential issue in his delivery — which affected his fastball as well, as linked above. Secondly, the reason he was unable to make proper adjustments very easily could be related to the personal issues he was facing during much of the year. Mechanics are very much a mental aspect of pitching; if you’re having trouble getting into the right head space, they can go off pretty easily. For an extreme example, look no farther than what happened to Brad Lidge after Albert Pujols hit the ball 500 feet off him in a playoff game.
If Estrada is right mentally (and we have no reason to believe he isn’t) and able to continually focus on correcting these flaws (he seemed to make a minor adjustment in July, only to overdo things in August), then he should be closer to the pitcher we’ve seen the for most of the last three years. If not, we could see another up and down year from the 33 year old.
Thankfully, we also have something of a track record to point to after three years of Estrada in Toronto, so the betting here is that he will be just fine in 2018.
Lead Photo © Nick Turchiaro-USA TODAY Sports
I think he was using it to often and the hitters were sitting on as he used it every batter.
He did use it a bit more often, but only negligibly so (32% vs 29% in 2016 and 28% in 2015). That’s not nearly enough of a change to cause that kind of difference in success.
Maybe just looking at the %s omits the element of batter expectations. If hitters were looking for it more often in 2017, it would have required them to adjust to it less often.
Using hypothetical guessing rates in a simplified model, if hitters guessed change 20% of the time in 2016, they’d have been been right on 5.8% of his pitches (29% x 20%). If they realized he threw 29% in 2016 and upped their guess rate to 30% in 2017, they’d have been correct 9.6% of the time.
The absolute absolute difference is only 3.8%, but the relative difference is much greater at 65.5%.
You’re asking a different question than Gene. You’re talking about hitter expectation based on past usage. But in reality, Estrada has been between 28-30% each year between 2014-2016, before the 32% this year.
Because of that, there’s no reason for hitter expectations to have changed dramatically from last year to this, and thus no reason for that to be even close to the main reason for the struggles with the pitch. So while your hypothetical would make sense, it doesn’t really track with any likelihood of matching reality.
In addition, his usage in the two months where the pitch was at its worst, he actually threw it less often (28.4% in June, 25.5% in August) than any other month.
Also, I don’t think hitters bring that kind of tendency data to the plate with them and guess pitches based on the information, though I could be wrong.
Yeah, I don’t think hitters step to the plate thinking “he threw 29% changeups last year”, but otoh, it doesn’t seem out of the question that as he has continued to throw ~30% year after year, hitters didn’t immediately start guessing at that rate, and instead, have tended to increase how often they sit on it because the body of data supporting such a guess has gotten larger and larger.
> He did use [the changup] a bit more often, but only negligibly so
You should make a chart plotting 2017 monthly CH usage versus results. I suspect there were spikes in CH usage.
I recall Estrada strugging through a start and he was throwing pretty much all changes at one desperate point. Hitters were laying off balls and sitting on strikes. Gibbons went to the mound and chewed him out. Estrada then threw seven or eight fastballs in a row.
The months where his changeup was worst (June and August) were also the months where he threw it the least frequently. He was 28.4% in June, 25.5% in August, over 30% every other month.
http://bit.ly/2iPDJ80