Back in February I wrote an article around the Statcast ‘Barrels’ metric and how the Blue Jays (new and returning) stacked up in regards to that metric. If you haven’t heard much about Barrels and their ‘official’ definition, that article would be a great spot to brush up on them. You can see the leaderboard here. Just the other day, Tom Tango tweeted out some visualizations of the different definitions of contact.
These are the six categories of the Radial Launch Profile.https://t.co/oZpa2tqSwu
Top line is Teddies, bottom line is ?!?Alfredos pic.twitter.com/sja9MQhhXJ— Tangotiger (@tangotiger) May 21, 2017
These are some nice tight visual groupings. And some R scores very close to 1. This means that from 2015-2016, the same batters generally had similar batted ball profiles. That’s a good indication that it isn’t a statistic that is a product of luck (like hitting with RISP vs. bases empty). Players who know how to barrel the ball one year tend not to forget how to do it the next. But can you change your batted ball profile if you know what you want to do differently? Let’s explore.
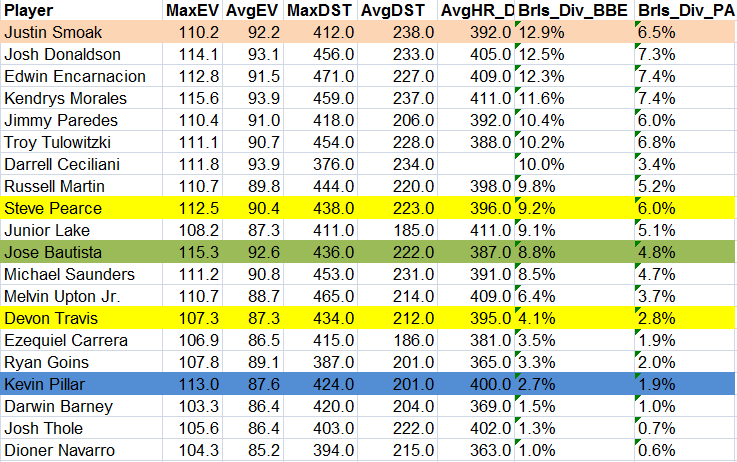
When we look at the 2016, we can see some winners and losers based on Barrels per Batter Ball Event (Brls_DIV_BBE).
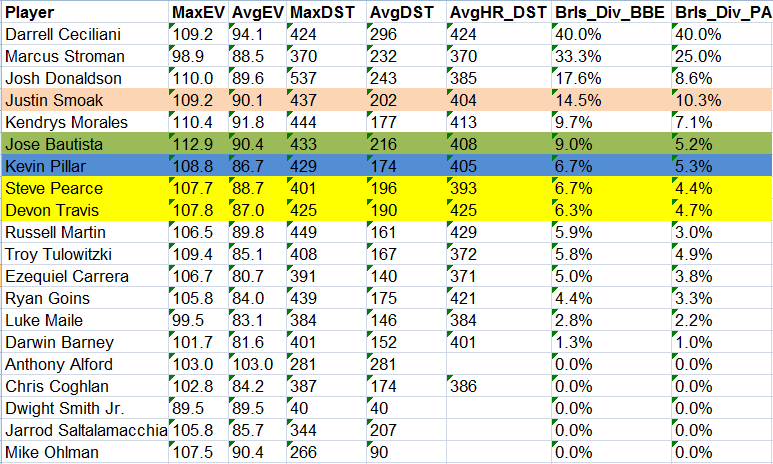
Who might be interesting to look at? Well, I highlighted them for us. Especially since we want to see what’s happened to their numbers this season. This is the 2017 chart.
Ah, yes. I’ve left Ceciliani and Stroman on the chart. That’s really to demonstrate how intuitive “Barrels” are. Both of them have a home run and a double in very limited PA and, as a result, have unsustainable numbers in the barrels categories. Instead, let’s look at a few of the players that are more worth highlighting.
Justin Smoak’s Made Real Changes
Smoak’s always been at the top of the ranking when considering batted ball events, but fell off significantly in Brls/PA in 2016 because he struck out 32.6% of the time. He simply did not make enough contact to do damage in a high percentage of his plate appearances. The 2017 version of Justin Smoak is more disciplined, and, back in the spring, he mentioned making a conscious decision to not try to hit a home run every time he got to the plate.
As a result, he’s jumped from barreling the ball in 6.5% of his plate appearances to 10.5%, which tops everyone on the Jays who plays regularly. This follows along with his strikeout rate, which dropped from 32% to 19%. Another way to measure this change in approach is with contact rate in the zone. According to FanGraphs, his zone contact rate jumped from 82% last year to 94% this year. Not swinging like everything needs to clear the fence has paid huge dividends for Smoak.
Jose Bautista Might be Worth Worrying About
Bautista was once one of the great power hitting threats in all of baseball. We know that these kinds of hitter have a barrel per batted event percentage of between 18 and 25 percent, and a barrel per plate appearance percentage of between 9 and 11 percent. When Bautista makes contact, he does so with authority, showing up with a high rank in average flyball distance. He also has one of the better peak and average exit velocities on the team. What it doesn’t quite translate into, however, is barrels. Alex Avila, Aaron Judge and Miguel Sano can barrel the ball over 20% of the time. Jose can only make it happen 9% of the time, which is Jean Segura and Kyle Seager territory. At this point in his career, Jose is still able to get on base, but not do the kind of damage he once did. You could certainly keep him up in the lineup, but it’s possible that the cleanup spot isn’t where he’s meant to be anymore.
Kevin Pillar’s Making Good on His Promise
Much has been made of Pillar’s very public declaration to change his approach at the plate. In 2016, he barreled up the ball about as often as Ryan Goins, which is to say, not often at all. In 2017, he’s taken a great leap forward, going from barreling the ball in 2.7% of his batted balls to 6.7%, and from barreling the ball in 1.9% of plate appearances to 5.3%. Kevin Pillar now hits the ball with authority, even slightly more often than Bautista does over all his plate appearances. This is very strong evidence that he has been able to make a meaningful change in his approach. Remember, Barrels are about process, not results. In Pillar’s case the results have certainly followed. His tAV has jumped from .232 to .302 with the new approach, his walks are up significantly, and his strikeouts are down. Pillar wanted to confine his swings to pitches that were really hittable, and every measure we have has shown him to be successful in that regard.
Steve Pearce and Devon Travis’ Numbers Are Diverging
I grouped Steve Pearce and Devon Travis together for a reason. In 2016, in a platoon role, Pearce was the far superior power hitter, and Travis looked like a middle infielder with little to no pop in his bat. In 2017, Travis got of to a rough start, but he’s been tearing the cover off the ball recently. Meanwhile, Pearce got incosistent playing time and then got hurt. Their Statcast profiles, however, come out incredibly similar in 2017. They max velocity, average distance, barrels per batted event, and barrels per plate appearance are all within a digit or two of one another. It’s no surprise Pearce’s tAV sits at .215 and Travis’ sits at .224. Again, the process predicts the results—both players have been worth -0.2 WARP. We should watch and see if their fortunes diverge once Pearce returns from injury.
The Blue Jays Aren’t Barrelling
Looking at the chart as a whole, one other thing becomes clear. The Blue Jays are not, as a group, barrelling up the ball nearly as much as they did in 2016. Jose Bautista’s 8.8% and 4.8% were buried in the middle of the list last year, but now his 9.0% and 5.2% are, essentially, fourth on the team. The lineup simply isn’t made up of guys who hit a lot of homers or doubles into the gap. That isn’t the only way to score runs, of course, since the 2017 team has scored 186 runs after 45 games, and the 2016 team has scored only 183. Maybe some of John Gibbons’ bunt and squeeze tactics are a result of him not seeing anyone who can hit the ball with authority and reacting accordingly.
Either way, there are things that we can learn from barrelled balls. First off, we can see that, over and over again, the nature of the contact with the ball is consistent with the quality of the result. There is no way to defend against a barrelled ball, and if you’re aware of a way to nudge the launch angle and exit velocity into a certain zone as a hitter, you should absolutely do that. The other lesson, from Smoak and Pillar, is that a change in approach can help a hitter with a hole in his game. Smoak didn’t need to make harder or better contact, he needed to make it more often. Pillar didn’t need to make more contact overall, he needed to make it in the strike zone. Teams can use this type of data (obviously with more sophistication) to target players where small changes might offer big payoffs. The small sliver of Statcast data that the public has access to offers an opportunity to change what skills are valued in the game, imagine what teams will be doing with the whole database at their fingertips.
Lead Photo: Nick Turchiaro-USA TODAY Sports


