Over the weekend the Toronto Blue Jays came to terms with free agent Joe Smith on a one year, three million dollar contract for the 2017 season. After losing mid-season sensation and setup man extraordinaire Joaquin Benoit to Philadelphia, a right handed void had emerged at the back-end of the bullpen, one which Mark Shapiro and Ross Atkins hope one of the better sinkerballers of the decade will be able to fill.
It’s more of an optimistic hope than a concrete guarantee because the 2016 season was none too kind to the sidearmer. His velocity and pitch usage patterns more or less remained consistent, but Smith saw his strikeout rate, walk rate, and home run rate all trend in the wrong direction for the third consecutive season, to the point where his value was below that of a replacement player by some measures. The worsening of the strikeout and walk rates didn’t help, but the greatest cause for this depreciation was a home run per fly ball rate (19.5 percent) that had more than doubled relative to the 2015 (8.5 percent) and 2014 (8.0 percent) seasons.
There could be some foundation behind this sudden and extreme struggle with the long ball. Smith made two separate trips to the disabled list last season; first on June 7th with a left hamstring strain, and then again on August 17th with … a left hamstring strain. In both instances Smith told the media that the injury had been plaguing him for a while, that the soreness had become too great, and that his delivery had been impacted – intentionally or otherwise – in an effort to protect his ailing leg.
From the Los Angeles Times, on June 7th: “It’s one of those things where once I started getting sore in abnormal areas, that set off some caution flags,” Smith said. “When you start getting sore in other places, it affects your delivery.”
From MLB.com, on August 17th: “I’m not 100 percent and I was trying to go through it, and I’m obviously not getting the job done out there,” Smith said. ”I think everybody felt it was in the best interest to get to 100 percent and do what I was traded here to do. It’s frustrating. I just want to get back and healthy and help this team.” Smith went on the disabled list in May because of a hamstring injury. “I started changing my delivery in the lower half and created a bunch of problems, and it took a while to get back,” he said.
The hamstring injuries resulted in Smith making 18 fewer relief appearances than he’d averaged from 2011 through 2015, but despite this considerably smaller sample, the right hander surrendered a career worst eight home runs – seven of which came against his sinker or fourseam fastball. He gave up four dingers on these pitch types in 2015, and just three in 2014. We know his velocity wasn’t suddenly the issue; Brooks Baseball has his sinker averaging 88.85 miles per hour in 2016, which is actually slightly up from the 88.60 it averaged the year prior. The story is much the same for his fourseam fastball. The sinker had half an inch more run and about an inch less sink, so a sharp decline in movement doesn’t appear to be the culprit either. What about location?
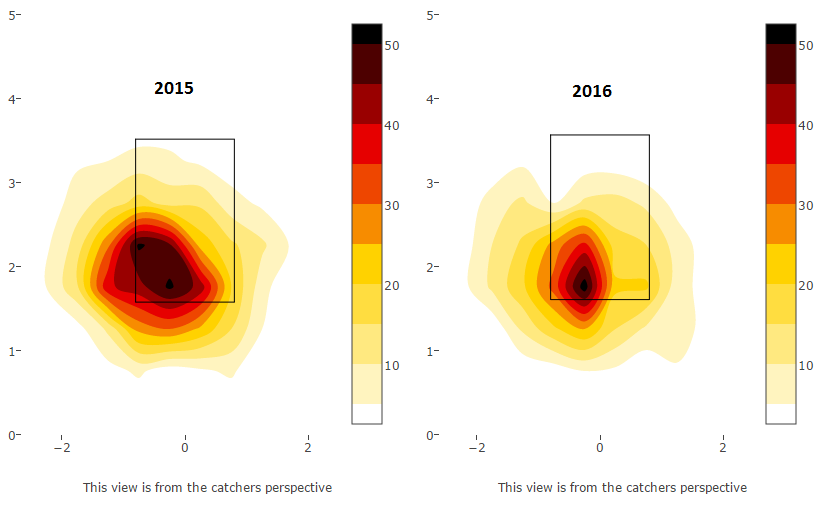
The figure above, composed from MLB Savant data, shows Smith’s sinker and fourseam fastball location in 2015 compared to 2016. There really doesn’t appear to be anything anomalous; his plan of attack is clearly to target the bottom of the zone, and use the natural arm-side run of his sinker to throw down-and-in to right handed batters, and down-and-away from left handed batters.
In summary: Smith’s sinker velocity is unchanged, the fluctuations in its movement don’t appear significant, and he located it about as well as he always has. It’s the same pitch, and yet the isolated power surrendered by the sinker has increased from .054, to .107, to .193 over the last three years, and the sinker-specific home run per fly ball rate has increased from 6.7 percent, to 16.7 percent, to 43.8 percent (!!!) over the same three years. What else could it be? Is Joe Smith tipping his pitches?
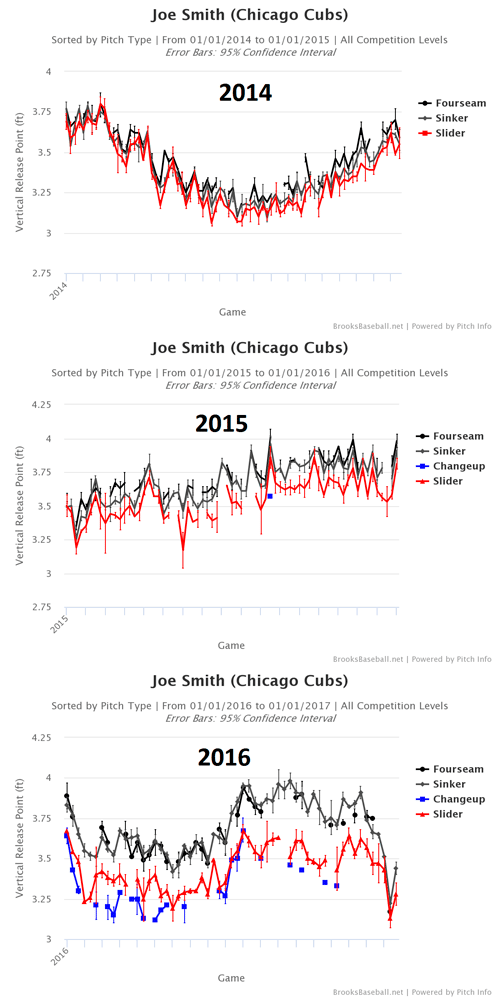
Uh, that seems like a definite possibility. The GIF above shows the average vertical release point for all of Smith’s appearances over the last three seasons. In 2014, the vertical release point for all of his pitch types was basically indistinguishable. In 2015 you start to see a bit more differentiation, and by 2016 there is a consistent three or four inches of separation between the vertical release point of his hard type offerings (black and grey) versus his soft type offerings (red and blue).
You or I might not be able to pick up this sort of seemingly minor difference while standing in the batters’ box watching Joe Smith deliver pitch-after-pitch, but professional hitters are very good at what they do. To better explain just how badly Smith is handicapping himself, we’re going to look at an exciting concept still in its infancy within the public domain: pitch tunnels.
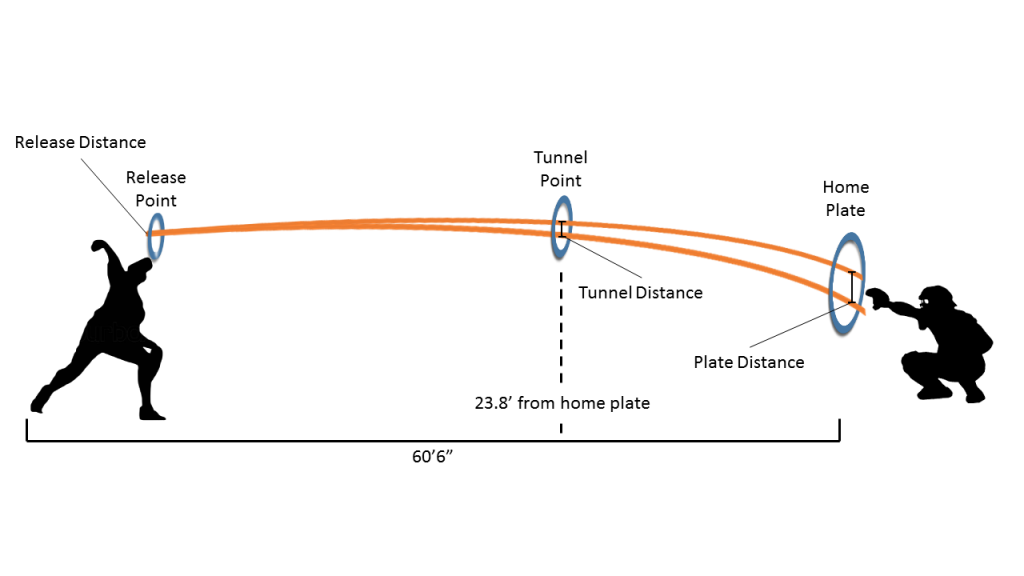
In late January, the statistics team here at Baseball Prospectus unveiled a massive and potentially ground-breaking project they had been working on behind the scenes. The entire article is a fascinating and highly recommended read, but for those here for the coles notes, the general concept of pitch tunneling is to measure how similar or dissimilar pitches look out of the hand and as they approach towards the plate, prior to entering their break patterns. Batters have a finite period of time in which to make their swing/take decision, and the longer a pitcher can disguise, for example, his fastball and his slider, the less time the batter has to react once the two pitches begin their drastically different final trajectories. The figure below better explains what exactly the BP team has measured.
In very general terms, pitchers want to minimize the “Release Distance” and “Tunnel Distance” (the latter of which BP describes as approximately 175 milliseconds before contact – the point at which a batter must make a decision), while maximizing the “Plate Distance”. From these three values, BP has also developed a pair of ratios, Break-to-Tunnel, and Release-to-Tunnel.
The first of those two ratios, as explained using BP’s definition, “… shows us the ratio of post-tunnel break to the differential of pitches at the Tunnel Point. The idea here is that having a large ratio between pitches means that the pitches are either tightly clustered at the hitter’s decision-making point or the pitches are separating a lot after the hitter has selected a location to swing at.” Basically, larger is better.
The second of those two ratios, again by means of BP’s definition, “… shows us the ratio of a pitcher’s release differential to their tunnel differential. Pitchers with smaller [ratios] have smaller differentiation between pitches through the tunnel point, making it more difficult for opposing hitters to distinguish them in theory.” In this case, smaller would seem to be better.
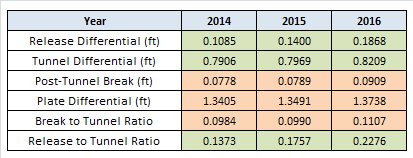
The table below details how Joe Smith has fared in these metrics over the last three seasons, and provides more empirical support to the theory that the right hander is making himself far too easy to pick up.
The statistics for which a smaller differential or ratio is desired have been colored in green; in orange are those for which a larger differential or ratio is optimal. The first thing that jumps off the page is that, for each year, each and every metric has universally gotten larger and larger. For things like post-tunnel break and plate differential that’s good, but not only are those gains extremely minor, they don’t come close to compensating for the expansion in his release differential and tunnel differential.
Since 2014, Joe Smith’s average release differential between pitches has increased from 1.3 inches (0.1085 feet) to 2.2 inches (0.1868 feet). It’s noteworthy that this is an average of the release differential for all sequences of his pitches; sinker to slider, sinker to sinker, sinker to fourseam fastball, changeup to slider, changeup to sinker, slider to slider, etc. The tunnel differential has increased as well, so when his pitches are reaching the decision point for the batter, they’re also further separated than in previous years.
I don’t know nearly enough about human physiology to know whether or not a constantly nagging hamstring could have this kind of impact on the vertical release point of his sinker relative to his slider, and in the same vein I don’t yet know nearly enough about pitch tunneling to know whether or not this is a trend that Joe Smith is capable of reversing at this stage of his career, but for a guy who relies on the sinker and slider about 80 percent of the time and struggles to eclipse 90 miles per hour with the sinker like Smith does, providing batters with a heads up on what’s coming both at the release and decision points is most certainly a recipe for failure. If Joe Smith is to again find success and keep balls away from the Rogers Center bleachers, making his sinker and slider look like the same pitch again should be priority number one for pitching coach Peter Walker and bullpen coach Dane Johnson.
Lead Photo: © Kevin Jairaj-USA TODAY Sports

been around the game for a long time. never seen this type of analysis. fantastic read.
Honestly, great article. I’ve never seen or heard a detailed analysis like this either. Gives me another thing to think about when pitching.
I’m glad you both enjoyed the article. I look to continue to bring interesting concepts forward that will, hopefully, make people think!