As the 2016 season is about to begin, let’s start by reminding ourselves that the Toronto Blue Jays of 2015 won with a particular group of players, and a particular brand of baseball. The method they chose, even when it didn’t get them the results they deserved, was, more or less, as follows: Score a lot of runs. Lots and lots of runs. Score so many runs other teams are embarrassed to compare their totals to yours. And then, after you’ve done that for a few months, figure out how to pitch like an average team. In a world of limited resources (both players and cash), not every team finds themselves with the ability to have other-worldy run scoring, or unbelievably stingy pitching. However, the Jays did handle one end of the game from both sides of the ball exceedingly well. They knew how to work the walk.
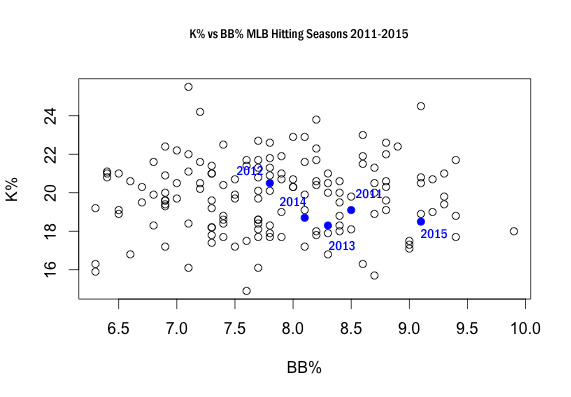
Offensively, the Jays took what they had and ran with it. They were an elite offense in many different ways. For the moment, I’m going to set aside the home runs, doubles and stolen bases. As you can probably guess from the previous paragraph, I’m going to talk about walks. I’m doing this because nobody remembers a really heroic walk, and they deserve better. Until last year, the Jays have historically not been a “tough out,” even with their power heavy lineup over the last five years. However, in 2015, the lineup made other pitchers hand out free passes plate appearances at a league leading level. The Jays had the highest walk rate in the American league, at 9.1 percent, and missed being the walkiest team in all of MLB, just 0.1 percentage points behind the Dodgers. In the last five years, over 150 combined seasons of baseball, last year’s Jays sit tenth on the list. When you combined that with the Jays’ aversion to striking out, you get something special. On a scatter plot, with K rate and walk rate, you can see the relative strength of the 2015 team vs. all the other seasons in the sample. Previous Jays seasons are highlighted for reference.
This team is up around the sparsely populated “happy” end of the graph. That would certainly help a team score a lot of runs. Of course, we’ve come to expect an offense that is better than average, so the 2015 offense isn’t a huge shock.
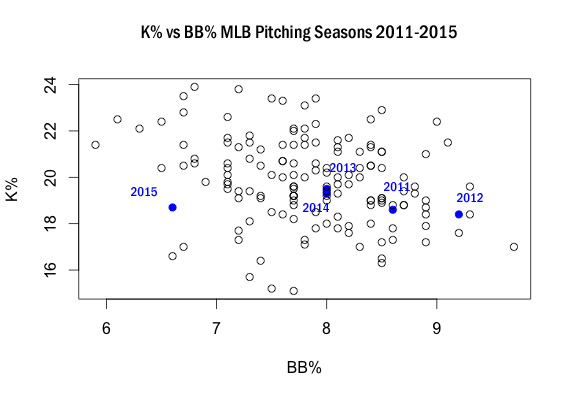
From the mound, things were a bit more surprising. The Jays have enjoyed a recent history of being some of the most generous pitchers in baseball. And I don’t mean that in a good way. Take those same 150 seasons of baseball from above, and flip them to the pitching side of the equation, and they reveal a staff that, on multiple occasions, did its best to hand out as many free passes as possible. The 2012 Jays were the fourth most walk prone team in the last five years, and the 2011 team comes in at 23rd. They did drop to 66th in 2013, and 69th in 2014, but those are both still on the wrong side of the midpoint. It needs to be mentioned that the strike zone, which is fixed in the rulebook, has been growing in the real world. As the strike zone continues to expand at the bottom, it gets more difficult to walk batters each year. In 2014, however, the Jays were still walking 8.0 percent of the batters they faced. Then in 2015, the Jays started off the same way, leading the AL in walks into the month of may. And that’s when something remarkable happened. The Blue Jays suddenly turned into a unit of pitchers with elite control. So much so, that by the end of the season, they had the fourth fewest walks in MLB. On our five year list of teams, the 2015 Jays sit at 144 of 150, and this is a list you want to be right at the bottom of.
When we look at a scatter plot the difference comes into sharp focus.
That’s a long trip from 2012 to 2015, but even the switch from 2014 to 2015 is a huge jump. The ability to limit the base on balls was truly out of character for recent Toronto teams.
So the question arises, how often does a team do these things, both take walks and limit walks at an elite level? Looking back at the top 15 teams (the top 10 percent) in each side of that five season sample, we come back with four teams on both lists. The 2014 Athletics ranked third best at taking walks, with the 14th fewest issued. The 2015 Dodgers were eighth and ninth, respectively. The 2015 Jays, as mentioned were 10th and seventh, and the 2015 Cubs were 11th and 13th. These teams won 88, 92, 93 and 97 games, and all of them got to at least a wild card game. Now, this is a nice correlation, but I’m not suggesting walk management is the only path to the playoffs. The elephant in the room here is the KC Royals, who wouldn’t take a walk even if they found a little old lady desperate to cross the street. They finished, in 2014 and 2015, with the fewest and second fewest walks taken in our five year sample. They still won the World Series. But that’s probably a story for a completely different post on a different website. Let’s focus on the Jays, and what walks mean for them.
The 2016 season is almost here, and I am curious to know whether either of those walk management performances are within the grasp of this new edition of the Toronto Blue Jays. I could get the back of this napkin all covered in pen marks trying to figure out what happens when you replace Ben Revere with Michael Saunders, and wave goodbye to Mark Buerhle and put Marcus Stroman in his place, or make any number of other possible roster tweaks. Why do that though, when I have the 2016 PECOTA spreadsheet at my disposal?
Let’s get to the bad news first. If I remove all the pitchers that I don’t expect to see at the MLB level this year from the mix…I still get way too many innings for a whole season. Projections systems can be funny like that. But I’m more concerned about the rate of walks, not the total number, so that’s just fine. Factoring in IP, walks, hits and hit batters, I come up with a walk rate of 8.4 percent. Batters reaching or error will factor in during the real games, skewing the number down slightly, but we don’t have a projection for how many errors the Jays will commit. On the graph it looks like this.
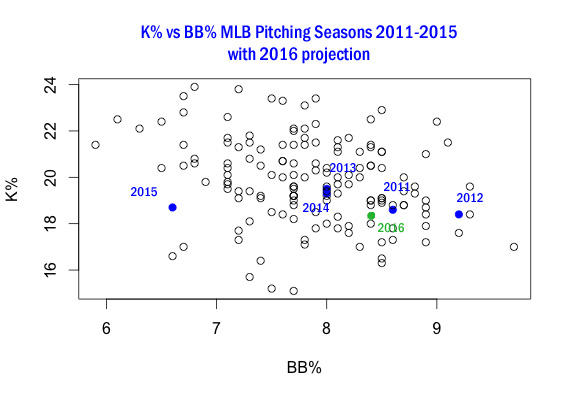 I told you it was bad news. Nothing about the revised pitching staff that the Jays take into 2016 projects to prevent walks the way they did in 2015. It would be nice, but it’s just not looking likely.
And quickly now, before we get depressed, let’s move on to the good news! Taking the PECOTA projections for batters, I pull out all of those not expected to see time at the major league level this year, and I’m left with 16 players. Using PECOTA’s projected walk and PA numbers, I do the simple division, and I get a walk rate of 9.4 percent. It looks like this:
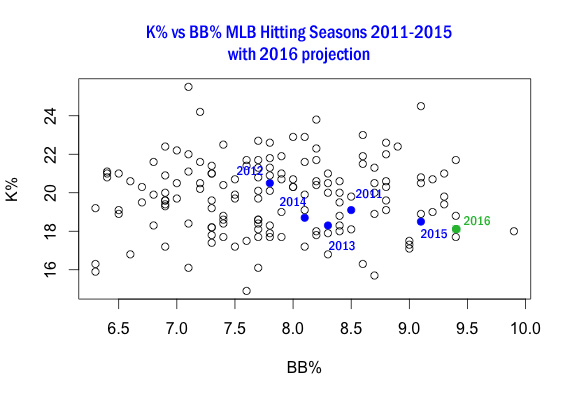 Yes, the lineup is projected to get even better at taking bases for free. So, if you enjoy opposing pitchers struggling to nibble away at the corners, and glancing into the on deck circle to contemplate their fate, Troy Tulowitzki, Jose Bautista, Josh Donaldson, Edwin Encarnacion, and company figure to be doing that even more than in previous years.
Of course, only time will tell what 2016 has in store. I encourage you, however, to remember the walks, even though they don’t make the highlight packages very often. They are an important part of the puzzle that makes a winning team, so they deserve their recognition.
Lead Photo: Brad Rempel-USA TODAY Sports
