Due to a calf injury suffered during an innocent looking run-down between first and second base, Brett Cecil‘s 2015 season ended on October 9th during game 2 of the ALDS. The Toronto Blue Jays’ season ended two weeks later, on October 23rd. Given the transcendent level at which he had been pitching, it doesn’t take much of a mental leap to envision the outcome of the latter being dramatically different if not for the former.
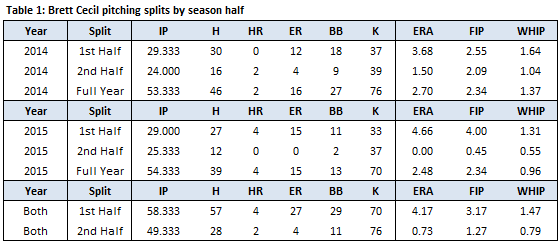
In a manner akin to his streak of second half dominance in 2014, from the 2015 All-Star break straight through to his unfortunate October conclusion, Brett Cecil was bar-none the best reliever in baseball. His FIP of 0.45 was first, with the second place mark held by the Astros’ Tony Sipp at a distant 1.59. Cecil’s xFIP was 1.15 — once again, first, and a comfortable distance ahead of the Orioles’ Zach Britton at 1.54. At 38.5 percent, Brett’s strikeout-minus-walk rate was, you guessed it, first, well ahead of Yankees’ closer Andrew Miller‘s second place 34.7 percent. If you’re old fashioned and only really, truly care about run prevention: the last time Brett Cecil allowed an earned run was June 21st. His second half ERA was a clean 0.00. From June 24th until his October 9th injury, Cecil made thirty-nine appearances spanning 32 and two-third innings, and allowed a total of zero earned runs.
As Table 1 above shows, in just under 50 total second-half innings across the last two seasons, the Blue Jays’ left hander has been beyond magnificent. As the graphs below display, something of a pattern has emerged between Cecil’s second half dominance and his increased reliance on his devastating breaking ball.
In both graphs, the blue line represents Cecil’s running curveball usage for the season, while the red line represents Cecil’s up-to-date FIP following each relief appearance. It should be noted that the first three games of each season were included in the data set but were not displayed on the graphs due to the volatility associated with such small sample sizes.
In 2014, Cecil’s curveball usage bounced around over his first forty-or-so appearances, but August 2nd appears to represent a turning point. The lefty threw 10 pitches, including just 2 curveballs, and gave up a pair of home runs — both on fastballs — to raise his season FIP from 2.45 to 3.22. From that point forward, Cecil threw a ridiculous 52.8 percent curveballs, and in the process would lower his season FIP by nearly a full run from 3.22 to 2.34 over just 21 appearances. His point of self-reflection appears to have occurred about a week earlier in 2015. Following his 36th appearance of the season on July 25th, his curveball usage was at a season-low 35.27 percent and his FIP was a good, but not quite Brett-like 3.69. In the final 27 regular season games, he threw 48.6 percent curveballs, gave up zero home runs and walked just one batter, lowering his season FIP by well over a run to 2.34.
Now, suggesting that Brett Cecil’s curveball is an outstanding pitch and that it’s the foundation for his continued excellence is not exactly wading into uncharted waters. What’s perhaps a more interesting proposition would be to attempt to determine a quantitative measure of just how good Cecil’s curveball is, and where it stands among its peers across baseball.
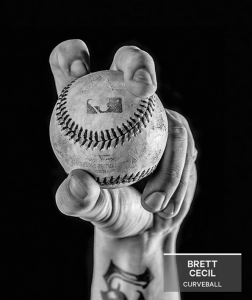
Brett Cecil is one of many pitchers who have taken up an altered grip on their curveball. The variation thrown by this second group is loosely classified as a “knuckle curve”, but even within this niche there are a pair of subclasses. A true knuckle curve has the knuckle of the index finger pressed flat against the ball, whereas for a pitcher who throws a “spike curve”, the ball is gripped with the nail of the index finger. This can be seen in the image of Brett Cecil’s grip above, via Sportsnet. Previous analysis has suggested that this grip is preferable if a pitcher has the requisite arm-speed, as knuckle/spike curveballs as a group have resulted in higher velocities, higher swinging strike rates, and higher groundball rates relative to their traditional counterparts. The presumption is that it has less of a “hump” out of the pitcher’s hand and is therefore harder to distinguish from a fastball.
Using the “Pitch Comp” methodology introduced by Jeff Sullivan of Fangraphs and included in many articles on Capital Jays over the past year, the “best” comparables for Brett Cecil’s curveball in 2015 were identified. Quotations were thrown around the word “best” because the list of similar pitches is a rather brief one. As a quick refresher behind the methodology:
The pitches were measured based on three variables: velocity, horizontal movement, and vertical movement. Using [Pitcher X]’s values for each pitch as the control, the comparator pitches had their Z-score measured. The Z-score allows us to calculate “the probability of a score occurring within a normal distribution” as well as, perhaps more importantly for this endeavor, to “compare two scores that are from different normal distributions”. For example, the velocity formula used is as follows:
Z-score = ABS (pitcher velocity – [Pitcher X] velocity) / velocity Std. Dev. of the population
The absolute value toggle is important as if [Pitcher X] throws his fastball at 93 miles per hour, we want pitchers who throw 92 and 94 to receive the same score as they’re both equidistant from the value we’re using as the benchmark. The above calculation was done in identical fashion for both horizontal movement and vertical movement, resulting in three Z-scores for each pitch. The Z-scores are unit-less so they can be summed to create, as Jeff Sullivan of FanGraphs describes, a single “Comp Rating” for the pitch. The closer to zero the rating is, the more similar the pitches are to one another.
The foundation for the analysis is the Pitch F/X leaderboard found here on Baseball Prospectus. The sample included both lefties and righties, and both starters and relievers, but in order to narrow down the sample to pitchers who truly feature a curveball and aren’t merely on the list as classification errors, the threshold was set to a minimum of 200 curveballs thrown.
The top two comparable curveballs belong to right handers, with Andrew Heaney of the Angels as the top lefty with a distant comp score of 1.81, and the most similar curveball thrown by a left-handed reliever belongs to J.P. Howell, with a score of just 2.68. In general, the pitch comp methodology is a fascinating tool by which you can gain insight into similarities that go largely unseen by the naked eye, but it’s equally fascinating when it suggests that a pitch stands apart from all others as a lone wolf.
While the comp score didn’t offer much insight, with the list of the 121 curveballs assembled, I thought it might be interesting to attempt to apply some scouting grades to certain characteristics of Brett Cecil’s curveball. As a crash course, the scouting scale in baseball spans from 20 to 80, with 50 representing major league average, and each ten above or below that average representing one standard deviation. The premise behind using this scale is that the first, second, and third standard deviations should include 68, 95, and 99.7 percent of any data set, respectively, therefore making it unnecessary to expand the scale to 10/90, or 0/100.
The top two rows of table 3 below show the averages and standard deviations for velocity, whiff/swing rate, and groundball percentage among the 121 hooks. The third row shows Cecil’s values in each of those three categories. The fourth and fifth rows are the most interesting, as they are the number of standard deviations Cecil is above the average, and the corresponding score on the scouting scale to the nearest half grade. At 84.56 miles per hour Cecil’s average velocity scores a 65 and ranks in the 94th percentile, his whiff per swing rate of 54.5 percent scores a 70 in the 96th percentile, and his groundball rate of 68 percent scores another 65 in the 91st percentile.
The exercise from above was quickly repeated to limit the group to southpaws, which shrunk the sample from 121 pitchers to just 52. It must be noted that in order to avoid having an embarrassingly low number of pitchers in the sample, the minimum was also reduced from 200 to 100 curveballs thrown. Among his most relatable peers, Cecil’s velocity, whiff per swing rate, and groundball rate ranked 1st, 2nd, and 5th, and received scouting scores of 75, 65, and 65 due to the adjusted averages and standard deviations.
Unfortunately, the movement element of a pitch is too convoluted by other factors to accurately and conclusively evaluate in a similarly quantitative manner. One of the foundations for pitch movement that is quantifiable, however, is spin angle, and the data is readily available on Texas Leaguers. It featured prominently in a pair of articles I’ve written; a breakdown of how good Marcus Stroman’s bowling ball sinker is becoming, and conversely, as a visual approximation of how jarringly inconsistent Drew Hutchison’s slider/cutter/slutter has been. The tool has been pulled from the shed once again, with one minor alteration for graphical purposes: the introduction of “absolute relative spin angle”.
Both of the articles cited in the previous paragraph spoke to the Magnus effect, which is a force that acts on a rotating object as it passes through a medium. The direction of the force corresponds to the angle at which the object is spinning. There are three possible absolute spin angles on a spherical baseball: 0 or 360 degrees (perfect topspin), 180 degrees (perfect backspin), and 90 or 270 degrees (perfect horizontal spin, depending upon the direction of rotation).
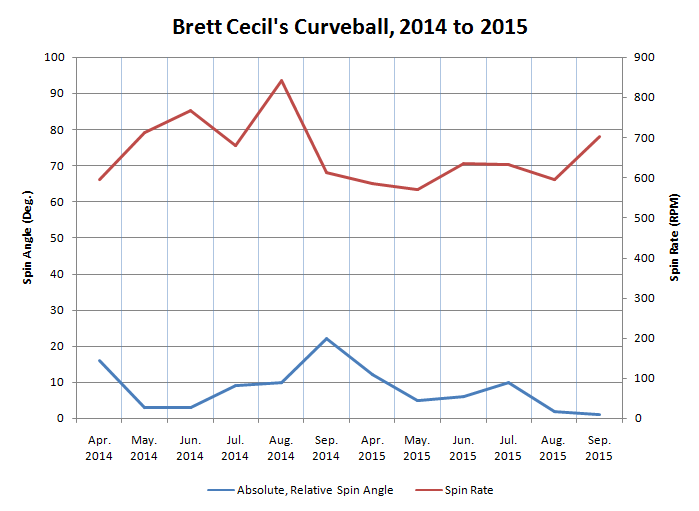
The reason that “absolute relative spin angle” must be used is because Brett Cecil’s curveball is so damn close to having perfect topspin, it drifts across the 0/360 degree margin. Simply put, the measure is the positive distance, in degrees, that the spin angle is from 0, and Brett Cecil’s two most recent seasons have been plotted on Graph 3 below on a month-by-month basis, with spin rate (in revolutions per minute) included for completeness. The right side of the graph, representing 2015, is the most fascinating. In no single month was his average curveball more than 12 degrees from perfect topspin, and in August and September — the two most pivotal months for the Blue Jays franchise over the past twenty years — Cecil’s average spin angle was an astonishing 2 and 1 degrees, respectively.
Given what we know about spin angle and its relationship with movement, it shouldn’t come as a shock to anyone that this near-zero spin angle (an average of 5 degrees for the year) resulted in the smallest amount of horizontal movement among the 121 curveballs evaluated above. Cecil’s curveball averaged just 0.43 inches of horizontal movement in 2015, which is well, well below the league average of 5.10 inches. This spin angle, alongside his overhead delivery, gives Brett Cecil’s curveball the truest 12-to-6 form in all of baseball.
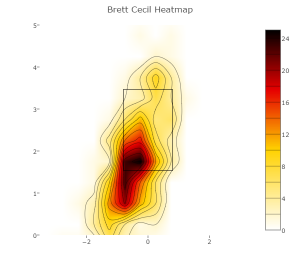
On top of possessing top-of-the-charts velocity and a unique path of movement, Cecil completes the trifecta with an impeccable ability to command and locate the pitch. Via Baseball Savant, the image below shows a heatmap of the location for all 323 curveballs thrown by Cecil in 2015. Squints pounded the low corner — down and away from lefties, in on the back foot of righties — time and time again, with his swinging strike plot following a similar but even further pronounced pattern.
We’ve already seen how this high-end velocity, unique movement, and pinpoint command combine to make Brett Cecil’s curveball one of the hardest with which to connect (as a reminder — his whiff per swing rate on the pitch ranks in the 96th percentile), but it’s just as challenging to pick up out of his hand in the first place thanks to its inherent knuckle-curve physiology. In 2015, batters swung at 50.5 percent of his curveballs thrown outside the zone, and 55.6 percent of those thrown inside the zone — basically a toss-up. Remarkably, this actually represents a considerable step back from 2014, when batters swung at 53.5 percent of those outside, and just 49.1 percent inside. Across the past two seasons and roughly 700 curveballs thrown, opposing batters are basically just as likely to swing at a ball-curve as a strike-curve, and that’s about as close as one can get to having a batter literally eating out of your hand. Just ask Brian McCann.
The expiring contracts of Jose Bautista and Edwin Encarnacion and the circus surrounding their negotiations have garnered all of the attention this spring, and deservedly so as two of the best hitters in baseball. Still, Mark Shapiro would be wise to pay heed to the financial status of one of the game’s most dominant relievers — one who just happens to make residence in the Rogers Centre bullpen — particularly given the increasing salaries being handed out to non-closers over recent winters, and especially since Cecil is projected to produce the sixth-most WARP among relievers in 2016. Drew Storen‘s 8.4 million is probably a good starting point; though the topic of a Brett Cecil extension is probably deserving of an article of its own. Needless to say, however, the sooner Brett Cecil’s contract becomes a priority for the front office, the better it will likely be for everyone.
Lead photo: Peter Llewellyn-USA TODAY Sports




The other key factor aiding the effectiveness of Cecil’s spike-curve is that, thanks to a better fitness regimen and the weighted-ball routine, his fastball velocity increased from 88-90mph to 95-97mph. Although he still mixes in the odd changeup, hitters have to be ready to hit that heater, but then they swing at a juicy fastball over the plate, only to see the curveball disappear out of the strike zone.